
Figure 1.
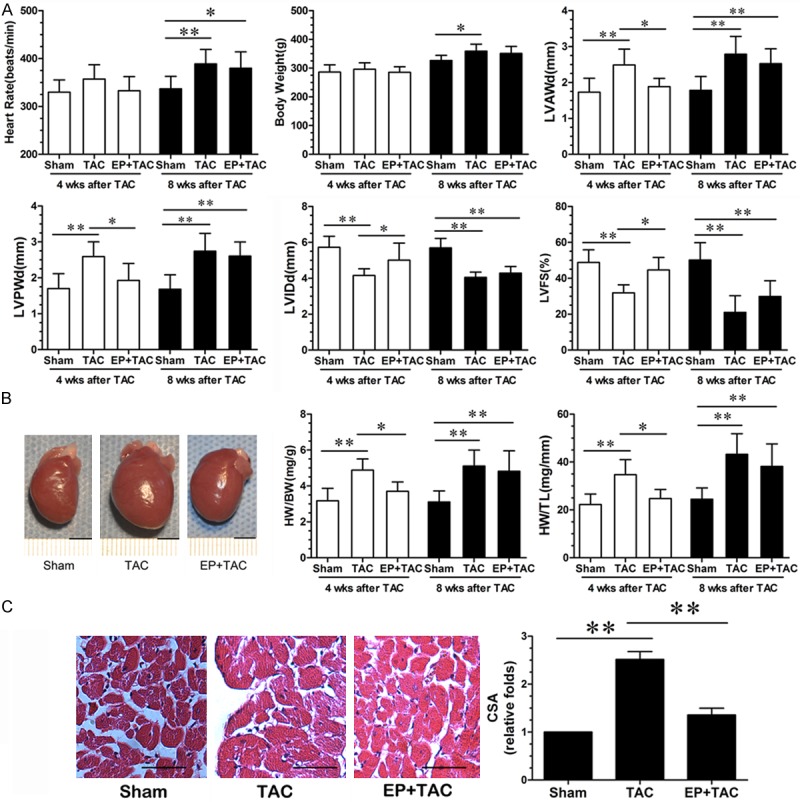
EP attenuated pathological cardiac hypertrophy induced by pressure overload. A: Echocardiographic analysis with representative M-mode tracings from 10 rats. All echocardiography data are shown as mean 6 S.E.M from 10 rats; LVAWd, LV anterior wall thickness at end-diastole; LVPWd, LV posterior wall thickness at end-diastole; LVIDd, LV internal dimension at end-diastole; LVFS, LV fraction shortening; B: Heart morphology and weight; representative global heart photographs of 5 rats (4 wks after TAC) (scale bar: 5 mm); heart weigh to body weight radio (HW/BW) and heart weight-to-tibia length ratio (HW/TL) measured from 5 rats; C: H-E stained LV sections of rats; scale bar: 100 μm; cross sectional area (CSA) of cardiomyocyte measured from 5 sections for one heart and 5 hearts (4 wks after TAC) examined; *P < 0.05, **P < 0.01.