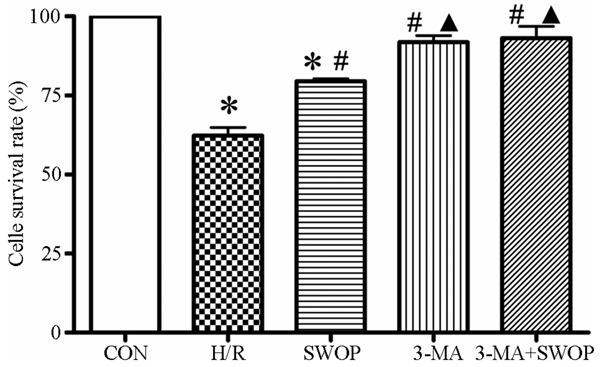
Figure 2.

The cell survival rate was meansured after different treatments in the control, H/R injury, sevoflurane preconditioning (SWOP), 3-MA and 3-MA+SWOP groups. Means ± SD for each group. *P < 0.05, H/R and SWOP vs control. #P < 0.05, SWOP, 3-MA and 3-MA+SWOP vs. H/R. ▲P < 0.05, 3-MA and 3-MA+SWOP vs. SWOP.
