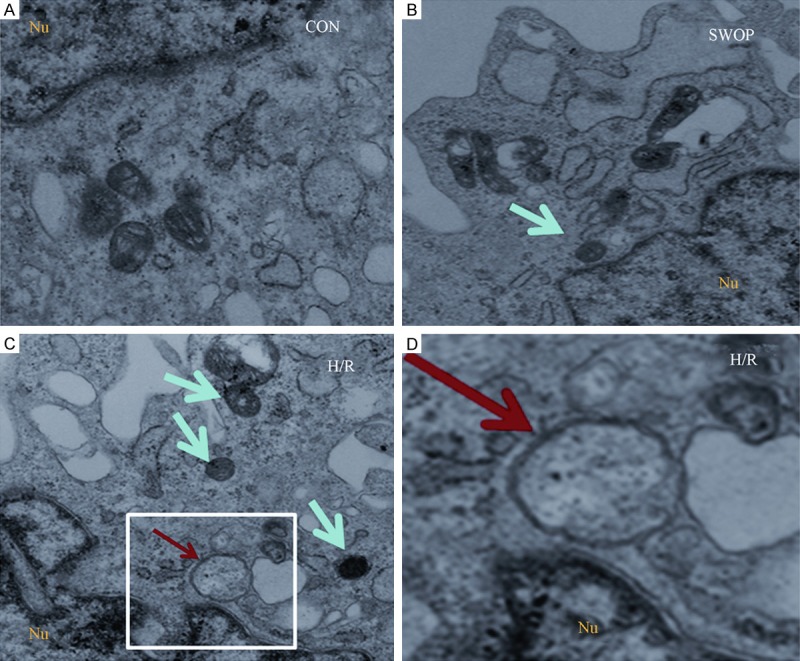
Figure 4.

The ultrastructure of the control group, H/R group and SWOP group H9c2 rat cardiomyocytes in the TEM. There was few or no autophagosomes in the control group. At the H/R group, typical autophagosomes with the characteristic double membrane are note (red arrow), the number of lysosomes increased (green arrow). The SWOP group were few of lysosomes apparent in the cytoplasm (green arrow).
