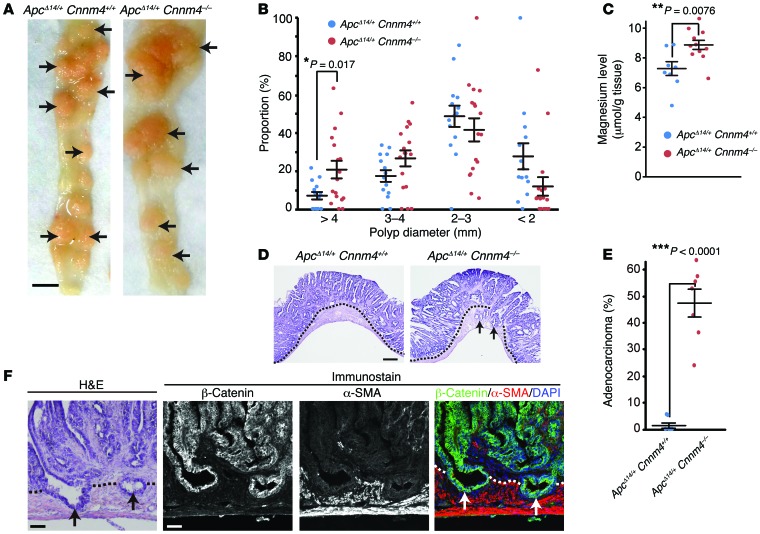
Figure 8. Genetic ablation of CNNM4 promotes cancer malignancy.
(A) Macroscopic views of the resected intestines of ApcΔ14/+ Cnnm4+/+ and ApcΔ14/+ Cnnm4–/– mice at 7 months of age. Polyps are indicated by arrows. Scale bar: 5 mm. (B) The size of each polyp was measured, and the size distributions of each mouse are shown (14 ApcΔ14/+ Cnnm4+/+ mice and 17 ApcΔ14/+ Cnnm4–/– mice). Black bars indicate the mean ± SEM. *P < 0.05 by 2-tailed Student’s t test. (C) Magnesium levels in the polyps were measured (≥3 per mouse), and the average levels for each mouse are shown (8 ApcΔ14/+ Cnnm4+/+ mice and 12 ApcΔ14/+ Cnnm4–/– mice). Black bars indicate the mean ± SEM. **P < 0.01 by 2-tailed Student’s t test. (D and E) Sections of the intestinal polyps were subjected to H&E staining, and the representative results are shown in D. Dotted lines indicate the boundaries between the epithelial layer and the smooth muscle layer, and arrows indicate adenocarcinomas that extended into the smooth muscle layer. Scale bar: 300 μm. The proportion of adenocarcinomas to total polyps was quantified for each mouse and is shown in E (7 mice for each genotype). Black bars indicate the mean ± SEM. ***P < 0.001 by 2-tailed Student’s t test. (F) Serial sections of the intestinal polyps from ApcΔ14/+ Cnnm4–/– mice were subjected to H&E (left) or immunofluorescence staining with anti–β-catenin (green), anti–α-SMA (red), and DAPI (blue) (right). Scale bars: 50 μm.

