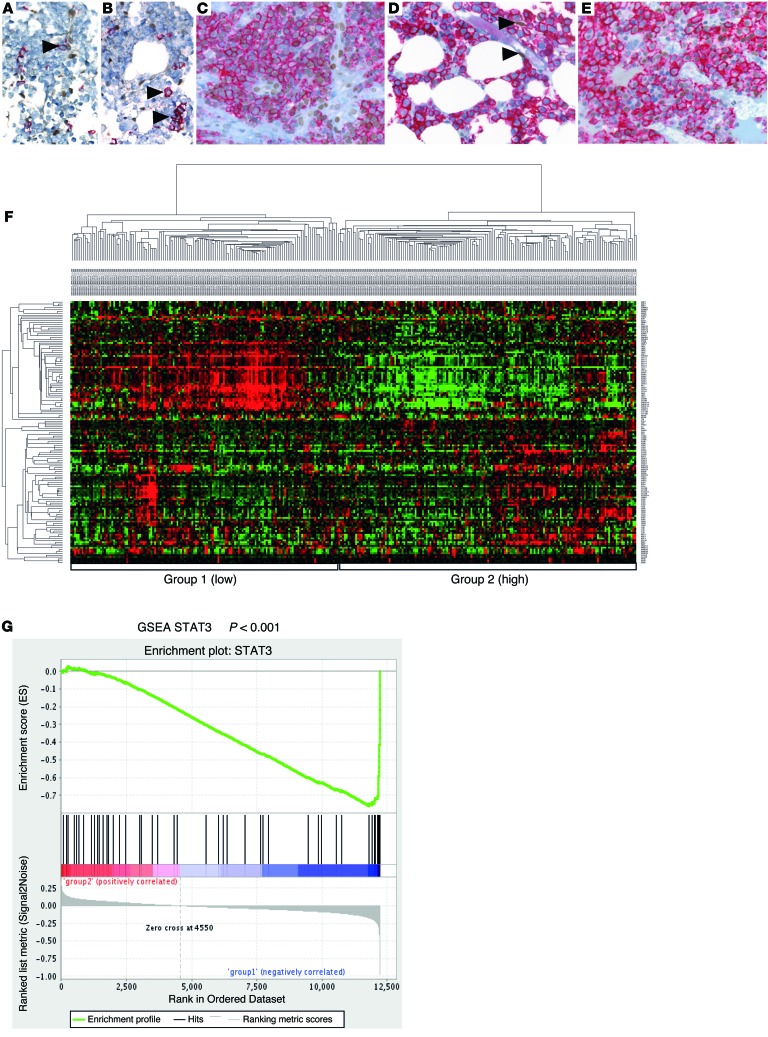
Figure 1. Expression of activated STAT3 and STAT3 target genes is a hallmark of human MM.
(A–E) Immunohistochemical double staining of human BM biopsies for P-STAT3 (brown nuclear stain) and CD138 (red membrane stain). Original magnification, ×400. Plasma cells (arrowheads) in normal BM (A) and MGUS (B) were negative for P-STAT3, whereas positive endothelial cells were clearly visible. (C and E) MM biopsy with nuclear P-STAT3 positivity in the majority of tumor cells. (D) MM biopsy negative for P-STAT3. 2 positive endothelial cells (arrowheads) are illustrated as internal positive control. (F) Hierarchical cluster analysis of n = 304 human MM samples (GEO accession no. GSE26760) based on a STAT3 activation–associated gene expression signature (n = 67 genes; ref. 19). Group 2 correlated with high STAT3 expression (i.e., STAT3 activation). (G) GSEA showed a significantly different distribution of the STAT3 activation–associated genes, with group 1 being negatively correlated (NES, –1.97; P < 0.001).

