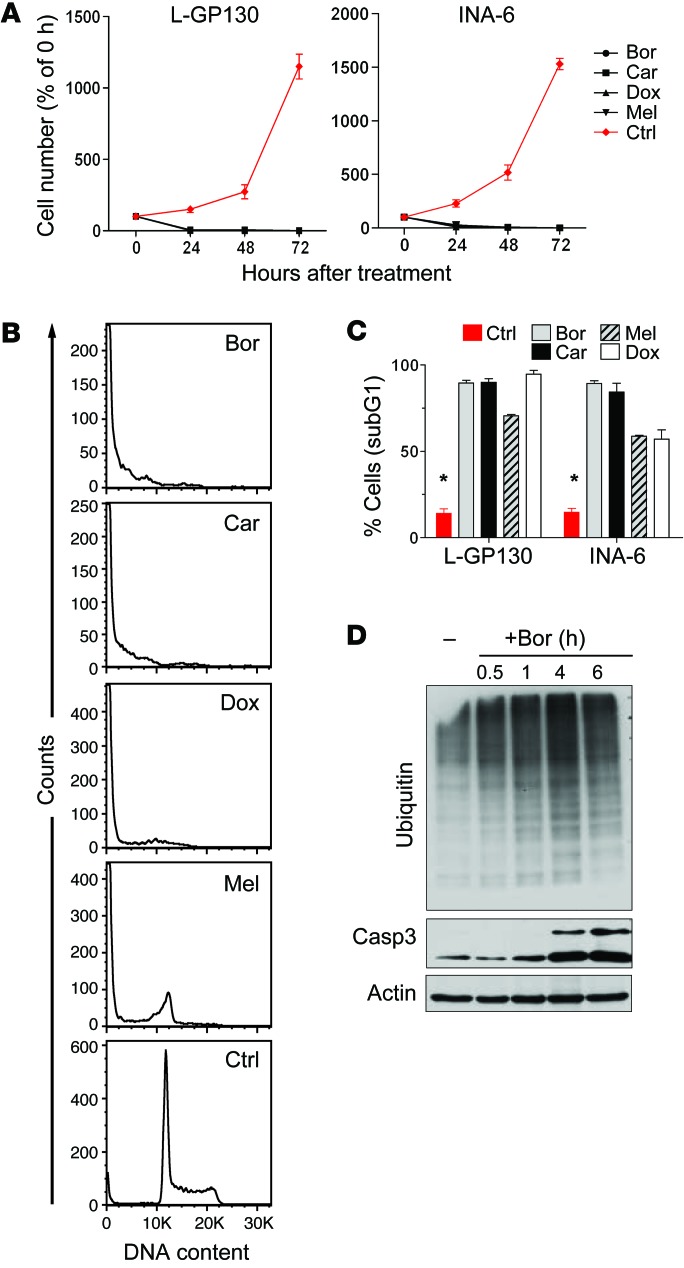
Figure 5. L-GP130–induced myeloma is responsive to classical myeloma treatments in vitro.
(A) Growth kinetics of primary in vitro–cultured L-GP130–expressing myeloma cells and the human MM cell line INA-6 treated with 200 nM bortezomib (Bor), 20 nM carfilzomib (Car), 100 μg/ml doxorubicin (Dox), or 100 μg/ml melphalan (Mel). n = 3 independent experiments; mean ± SD. (B) Primary L-GP130–expressing myeloma cells were treated for 24 hours with drugs as in A and assessed for DNA content using PI to estimate apoptosis and cell cycle state. Histograms show results of 1 representative experiment. (C) Quantitative PI analysis of primary L-GP130 myeloma cells and human INA-6 cells after treatment with drugs as in A. Mean ± SD is shown. *P < 0.05, control vs. treated groups. (D) Accumulation of mono- and polyubiquitinylated proteins and cleaved caspase 3 (Casp 3) in primary L-GP130–expressing cells treated with 400 nM bortezomib for the indicated times. 1 representative immunoblot is shown.

