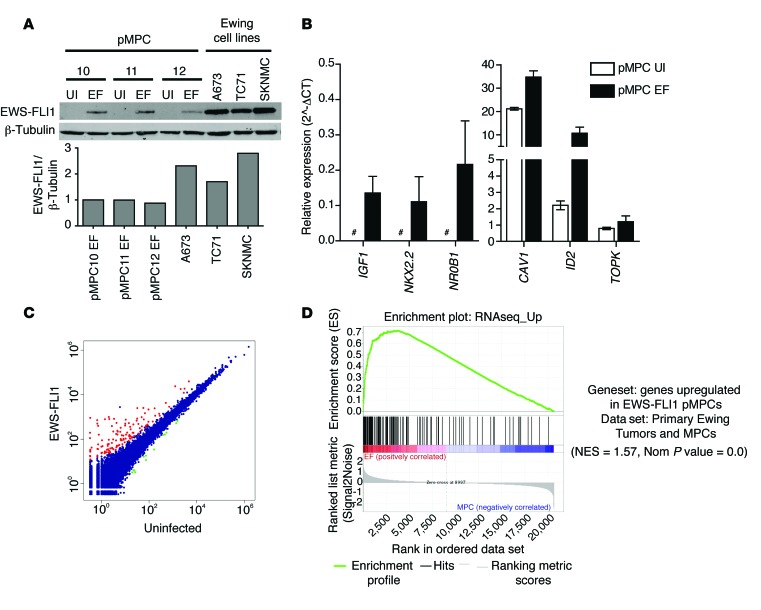
Figure 1. Expression of EWS-FLI1 in pMPCs.
(A) Western blot analysis of EWS-FLI1 induction in 3 pMPC isolates following addition of doxycycline for 13 days. Levels of EWS-FLI1 protein in 3 Ewing sarcoma cell lines (A673, TC71, and SKNMC) are shown for comparison. Relative protein levels are shown (EWS-FLI1/β-tubulin), normalized to pMPC10 EWS-FLI1. EF, EWS-FLI1; UI, uninfected. (B) Known EWS-FLI1 targets are upregulated in pMPC cells expressing EWS-FLI1. Expression is shown relative to HPRT. Error bars indicate standard error of the mean for n = 2. Pound signs indicate expression below the detection threshold. (C) RNAseq identified 157 upregulated genes (red) and 13 downregulated genes (green) in 3 pMPC isolates expressing EWS-FLI1 compared with uninfected controls (blue). Data indicate average read counts for the 3 MPC lines. (D) Gene set enrichment analysis analysis using a published data set of genes expressed in Ewing sarcoma tumors compared with primary MPCs and a gene set comprised of the upregulated genes identified in pMPCs.

