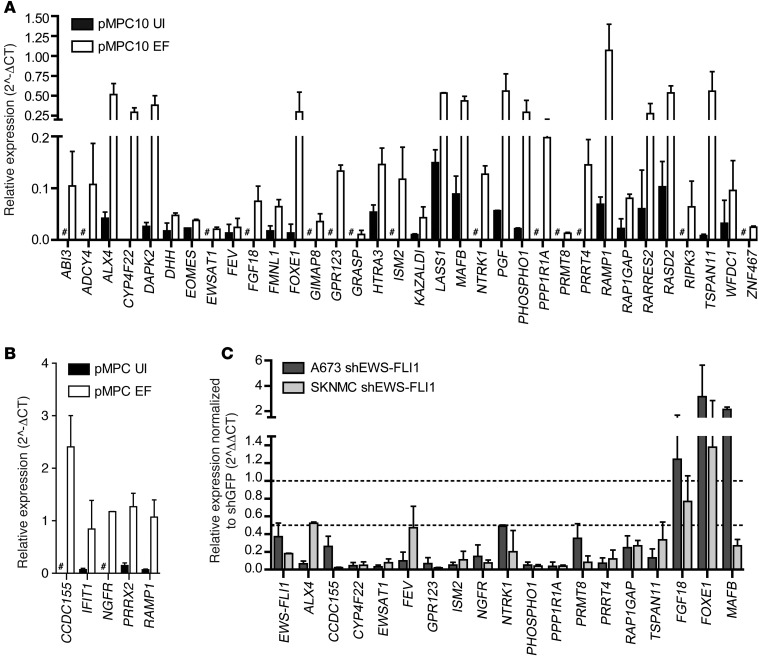
Figure 2. Validation of EWS-FLI1 targets in pMPCs and Ewing sarcoma cell lines.
(A and B) RT-PCR for genes identified as upregulated by EWS-FLI1 in pMPCs. Expression levels are relative to HPRT. Pound signs indicate expression below the threshold for detection. (C) RT-PCR analysis of a subset of target genes in A and B in 2 Ewing sarcoma cells lines after EWS-FLI1 knockdown. Expression normalized to shGFP. Error bars represent SD for n = 2.

