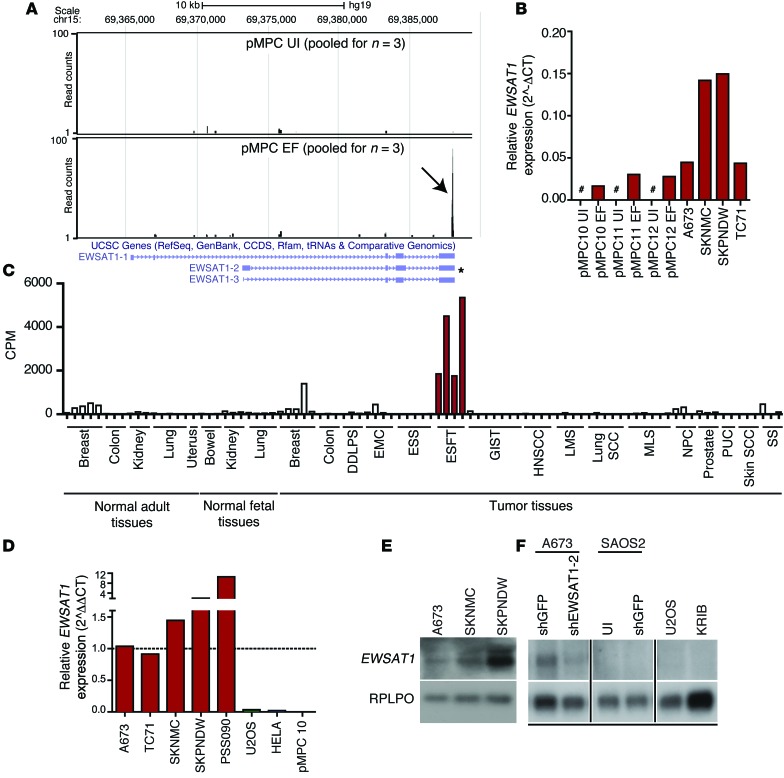
Figure 3. EWSAT1 is a lncRNA expressed in Ewing sarcoma.
(A) Visualization of reads mapped to the EWSAT1 locus in either control MPCs (pMPC UI) or EWS-FLI1–expressing MPCs (pMPC EWS-FLI1). Black arrow indicates accumulation of reads at the 3′ end of pMPCs expressing EWS-FLI1, whereas almost no reads are detected in the control. Tracks indicate pooled reads from either 3 controls or 3 pMPCs expressing EWS-FLI1. Predominant known isoforms are indicated below tracks. Asterisk indicates most abundant isoform, as determined by RT-PCR (see Results) (B) RT-PCR for EWSAT1 in uninfected pMPCs, EWS-FLI1–expressing pMPCs, and in 4 Ewing sarcoma cell lines. EWSAT1 expression is quantified relative to HPRT. Pound signs indicate expression below the threshold for detection. (C) cpm reads mapped for EWSAT1 in the RNAseq data set generated from a panel of primary human tumors and normal samples. DDLPS, dedifferentiated liposarcoma; EMC, extraskeletal myxoid chondrosarcoma; ESS, endometrial stromal sarcoma; ESFT, Ewing sarcoma family of tumors; GIST, gastrointestinal stromal tumor; HNSCC, head and neck; LMS, leiomyosarcoma; MLS, myxoid liposarcoma; NPC, nasopharyngeal carcinoma; PUC, papillary urothelial carcinoma; SS, synovial sarcoma. (D) RT-PCR for EWSAT1 in 4 Ewing cell lines and a primary patient-derived xenograft (PSS090) compared with the indicated non-EWS-FLI1–expressing cells. EWSAT1 expression is relative to HPRT and normalized to A673. (E) Northern blot detection of EWSAT1 in 3 Ewing cell lines. (F) Northern blot detection of EWSAT1 in A673 Ewing cells (control vs. knockdown of EWSAT1) and in osteosarcoma cell lines SAOS2, U20S, and KRIB. All lanes were run on the same gel but were noncontiguous.

