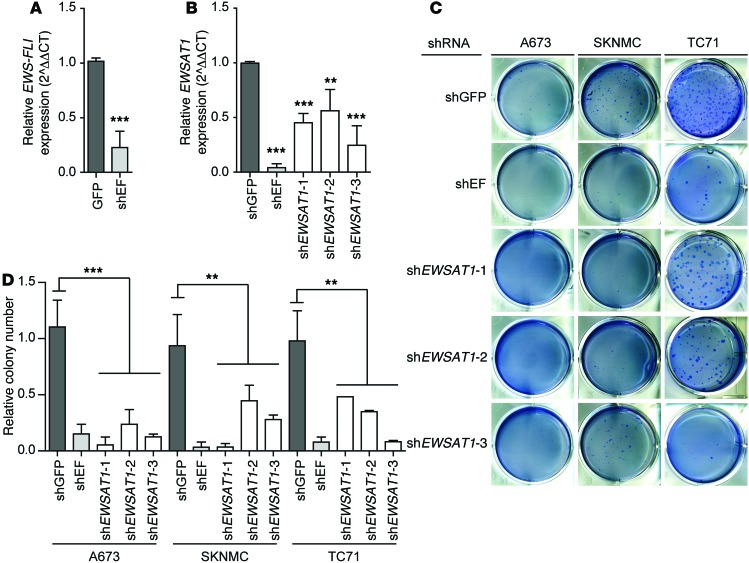
Figure 5. Knockdown of EWSAT1 decreases soft agar colony growth of Ewing sarcoma cell lines.
(A) RT-PCR for EWS-FLI1 expression in the A673 Ewing cell line transduced with shRNAs for GFP or EWS-FLI1. RT-PCR normalized to shGFP. (B) RT-PCR for EWSAT1 expression in the A673 Ewing cell line transduced with shRNAs for GFP, EWS-FLI, or EWSAT1. RT-PCR normalized to shGFP. (C) Representative images of soft agar colony assay in cells infected with indicated shRNAs. (D) Quantification of soft agar colonies normalized to uninfected cells. Error bars represent SD for n = 2–5. t test was performed comparing colony numbers for shGFP and colony numbers for all 3 shRNAs together. **P < 0.01, ***P < 0.001 by 2-tailed t tests.

