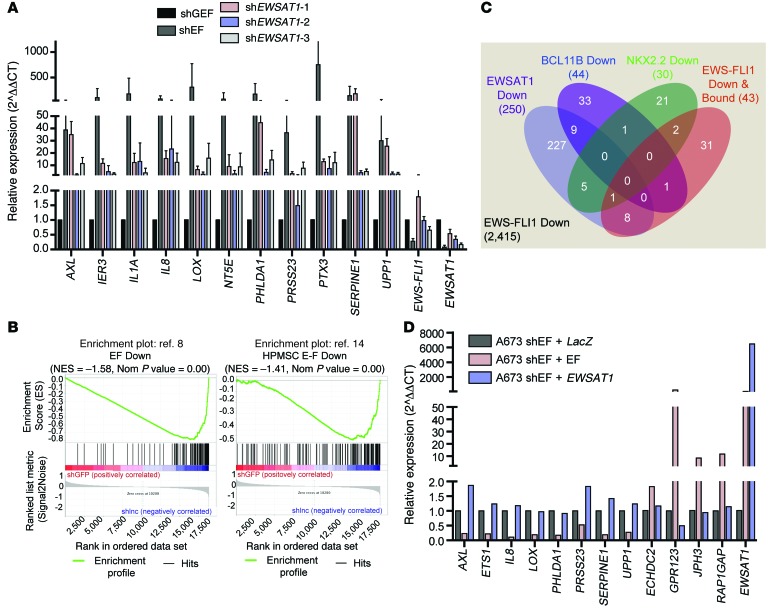
Figure 7. EWSAT1 mediates a mechanism of gene repression downstream of EWS-FLI1.
(A) RT-PCR validation of genes identified as repressed by both EWS-FLI1 and EWSAT1. RT-PCR normalized to shGFP. Error bars represent SD for n = 3. (B) Gene set enrichment analysis of 2 published EWS-FLI1 gene sets in the data set of EWSAT1-regulated genes in A673 cells. (C) Venn diagram of the overlap between the indicated data sets within the set of genes repressed by EWS-FLI1, as defined by RNAseq in A673 cells. See Methods for source of each indicated gene set. (D) RT-PCR on A673 Ewing sarcoma cells with knockdown of EWS-FLI1 and overexpression of cDNAs for LacZ, EWS-FLI1, or EWSAT1. LacZ was used as a control cDNA. RT-PCR normalized to shEWS-FLI1 + LacZ.

