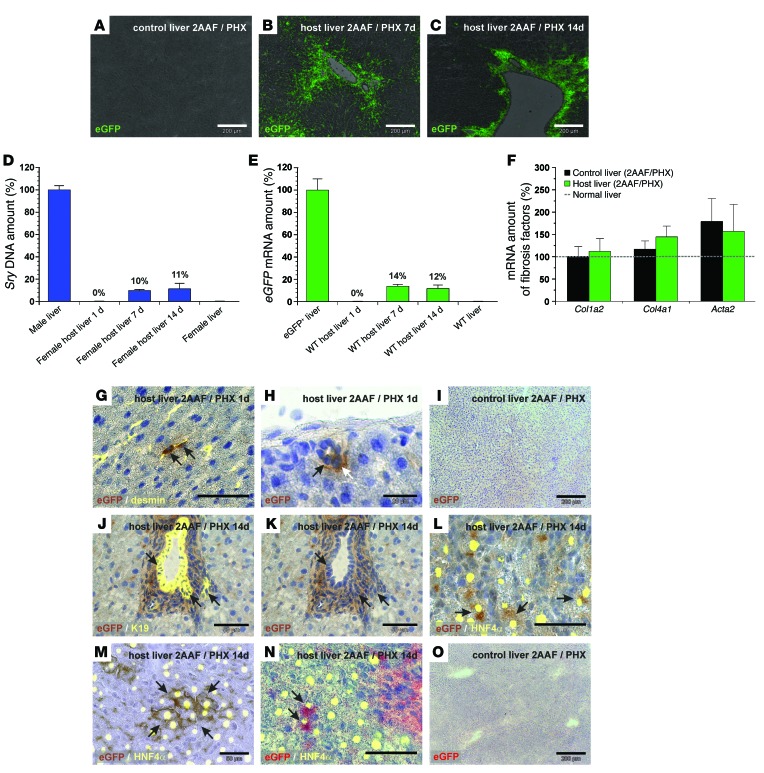
Figure 2. Transplanted eGFP+ HSCs home to the injured WT host liver and contribute to liver regeneration (2AAF/PHX model).
eGFP immunofluorescence (green) of (A) WT control livers and WT host livers (B) 7 and (C) 14 days after HSC transplantation. qPCR of (D) Sry DNA and (E) eGFP mRNA on days 1, 7, and 14 after transplantation of male eGFP+ HSCs (n = 5). Livers of (D) males (n = 6) and females (n = 4) or (E) transgenic eGFP+ (100%, n = 3) and WT rats (0%, n = 3) were used for normalization. (F) qPCR of Col1a2 chain, Col4a1 chain, and Acta2 in rat livers from the 2AAF/PHX model with (n = 5) and without (control, n = 8) transplanted HSCs on day 14. (G and H) DAB immunohistochemistry of eGFP (brown) in WT host liver 1 day after HSC transplantation. (G) eGFP+ HSCs were identified by desmin immunofluorescence (yellow; zone 2). (H) HSC-derived cells within (black arrow) or associated with (white arrow) bile ducts (zone 1). (I) WT control liver without DAB immunohistochemistry of eGFP. (J–M) DAB staining of eGFP (brown) 14 days after transplantation of eGFP+ HSCs. (J) K19-expressing cells (yellow) in bile ducts with (J and K) eGFP are indicated with arrows (zone 1). eGFP+ hepatocytes (brown; arrows) identified by HNF4α immunofluorescence (yellow) (L) in zone 1 and (M) zone 3. (N) Fast red staining of eGFP+ (red) hepatocytes with HNF4a (yellow; arrows; zone 1). (O) eGFP fast red staining of WT control liver. Scale bars: 200 μm (A–C, I, and O); 50 μm (G and J–N); 20 μm (H).

