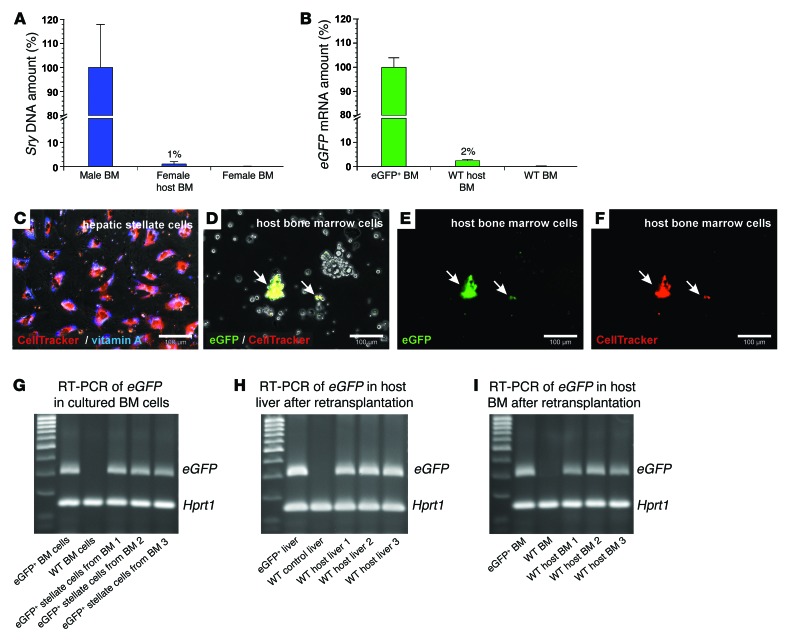
Figure 5. Engraftment of transplanted eGFP+ HSCs in the BM of WT host animals and their retransplantation (2AAF/PHX model).
qPCR of (A) Sry DNA and (B) eGFP mRNA within 14 days after HSC transplantation (n = 5). The relative Sry DNA or mRNA amount of BM samples from male or eGFP+ rats (100%, n = 4) and female or WT rats (0%, n = 4) were used for normalization. (C) Fluorescent CellTracker (red) staining of isolated HSCs. HSC identity was verified by vitamin A fluorescence (blue). (D–F) eGFP+ HSCs stained with CellTracker were injected into WT rats (2AAF/PHX model) and isolated from the BM 1 day after transplantation. (D) Transmission light microscopy and merged fluorescence of (E) eGFP and (F) CellTracker (red) staining of BM cultures. Arrows indicate eGFP+ and CellTracker+ HSC–derived cells. (G) BM cells with eGFP+ HSC–derived cells were expanded in culture, and the presence of eGFP mRNA was verified by RT-PCR after 14 days (n = 3). BM of eGFP+ and WT rats served as positive and negative controls for eGFP expression. (H) eGFP+ HSC–derived cells in BM cell cultures (shown in G) were retransplanted into 3 different WT rats (2AAF/PHX model) and detected in the (H) liver and (I) BM of all host animals after 14 days by RT-PCR of eGFP mRNA. Hprt1 mRNA was used to demonstrate equal mRNA amounts in all samples. Scale bars: 100 μm (C–F).

