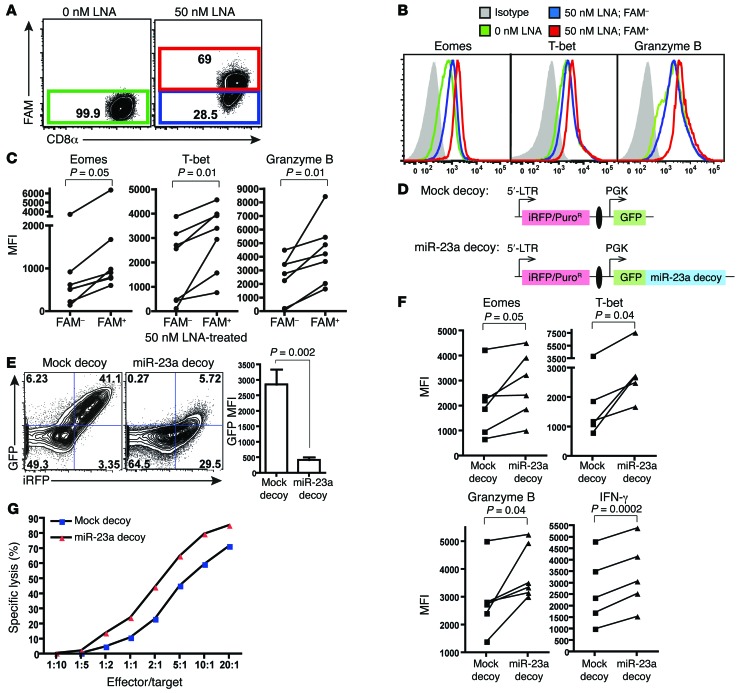
Figure 3. Functional blockade of miR-23a enhances CTL effector responses ex vivo.
(A–C) Purified naive pMel-1 CTLs were activated with anti-CD3/anti-CD28 for 48 hours in vitro, with or without 50 nM FAM-tagged anti–miR-23a LNA. (A) Gating strategy to identify CTLs that have taken up the anti–miR-23a LNA. (B) CTL effector molecule expression in untreated (0 nM LNA), FAM– LNA-treated (50 nM LNA; FAM–), and FAM+ LNA-treated (50 nM LNA; FAM+) CTLs. Representative histograms of n = 6 independent experiments. (C) MFI of CTL effector molecules in FAM– and FAM+ CTLs treated with 50 nM anti–miR-23a LNA; n = 7. P values were determined by 2-tailed paired t test. (D) Schematic of the mock decoy and miR-23a decoy retroviral expression vectors. iRFP was the internal marker for monitoring transfection efficiency; puromycin resistance (PuroR) was the selection marker for enriching engineered cells; GFP was a reporter for miR-23a sequestration and decoy function. The iRFP and GFP decoy expression cassettes were separated by an insulator (51) (black oval). (E) Left: Representative dot plots of iRFP and GFP expression in pMel-1 CTLs transduced with the miR-23a decoy, where iRFP was used as the internal marker. Right: Quenching of GFP intensity by the miR-23a decoy in CD8+iRFP+ CTLs. Bar graph represents mean ± SEM; n = 6. (F) pMel-1 CTLs retrovirally transduced with a mock decoy vector or the miR-23a decoy vector were assessed for CTL effector molecule expression in vitro. P values were determined by 2-tailed paired t test. (G) In vitro cytotoxicity of sorted iRFP+ mock and miR-23a decoy–expressing OT-I CTLs. Representative data of n = 3 independent experiments.

