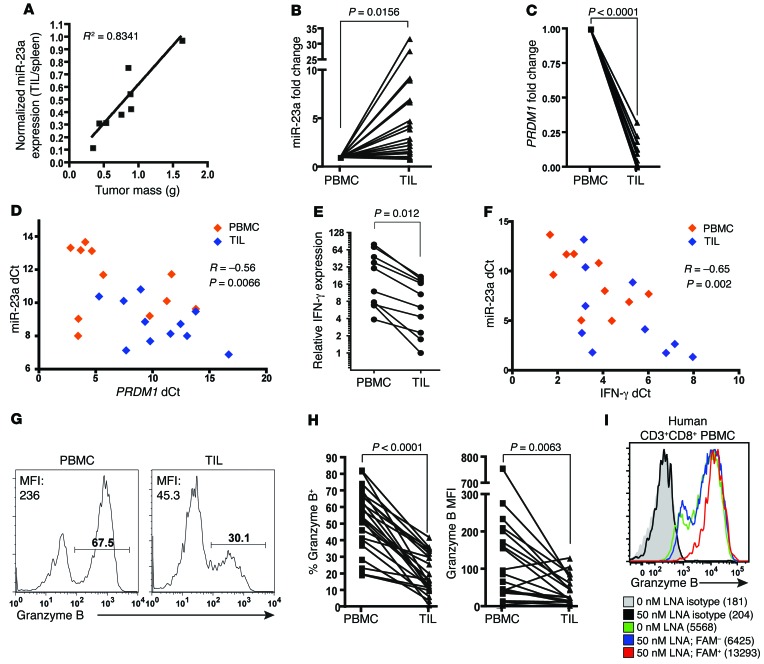
Figure 7. miR-23a expression correlates inversely with antitumor potential of mouse and human TILs.
(A) miR-23a expression in TILs isolated from C57BL/6 mice bearing B16/F10 tumors. miR-23a expression in TILs was normalized to basal expression of splenic CTLs in each individual mouse. Linear regression was conducted and the R2 coefficient is shown. (B–I) CD3+CD8+ CTLs from the pleural aspirates (TIL) and peripheral blood (PBMC) of advanced lung cancer patients were assessed for miR-23a and CTL effector molecules. Relative (B) miR-23a (n = 23), (C) PRDM1 (n = 10), and (E) IFNG mRNA (n = 10) expression in patient TILs, expressed as a fold change compared with patient-matched CD3+CD8+ PBMCs. miR-23a was normalized to the average ΔCt of U6 and RNY3 endogenous controls, while mRNA was normalized to the average ΔCt of 18S RNA and RPLP0 endogenous controls (details in Methods). Scatterplots of miR-23a versus (D) PRDM1 (n = 11) or (F) IFNG mRNA (n = 10) expression in CD3+CD8+ T cells from lung cancer patients. The miR-23a ΔCt from each PBMC or TIL sample is plotted against its corresponding mRNA ΔCt. The Pearson correlation coefficients (R) and 2-tailed P values are shown. (G) Representative granzyme B histograms of CD3+CD8+ PBMCs and TILs. (H) Percentage granzyme B+ and granzyme B MFI from CD3+CD8+ PBMCs and TILs (n = 23). (I) Granzyme B expression in untreated (0 nM) or LNA-treated (50 nM) activated human CD3+CD8+ T cells from healthy donor PBMCs. Numbers indicate granzyme B MFI. Histogram is representative of n = 3 independent experiments. P values in B–D were determined by 2-tailed paired t test.

