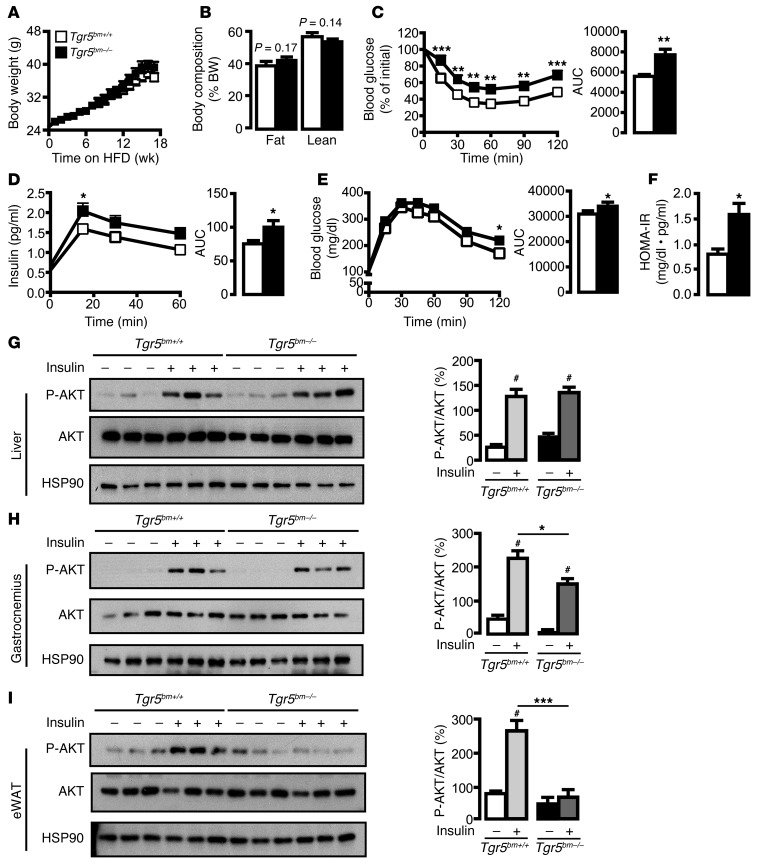
Figure 1. Tgr5bm–/– mice display impaired insulin responsiveness.
(A) Body weight curves of Tgr5bm+/+ and Tgr5bm–/– mice fed HFD for 18 weeks. n = 12 per group. (B) Body composition (fat and lean mass) of Tgr5bm+/+ and Tgr5bm–/– mice, determined by EchoMRI. n = 12 per group. (C) Left: Blood glucose levels during ITT (insulin; 0.5 U/kg) in Tgr5bm+/+ and Tgr5bm–/– mice fed HFD for 16 weeks. Right: Average area under the curve (AUC). n = 12 per group. (D) Left: Plasma insulin levels during OGTT in Tgr5bm+/+ and Tgr5bm–/– mice fed HFD for 14 weeks. Right: Average AUC. n = 12 per group. (E) Left: Blood glucose levels during OGTT in Tgr5bm+/+ and Tgr5bm–/– mice fed HFD. Right: AUC. n = 12 per group. (F) HOMA-IR of HFD-fed Tgr5bm+/+ and Tgr5bm–/– mice. n = 12 per group. (G–I) Western blot of phospho-AKT (P-AKT, Ser473), total AKT, and HSP90 in (G) liver, (H) gastrocnemius muscle, and (I) eWAT of HFD-fed Tgr5bm+/+ and Tgr5bm–/– mice injected i.p. with vehicle or insulin (1 U/kg; 10 min). Quantitative densitometry of Western blots is also shown. n = 6 per group. Results represent mean ± SEM. *P < 0.05, **P < 0.01, ***P < 0.001 vs. genotype; #P < 0.001 vs. control, 2-tailed Student’s t test or 1- or 2-way ANOVA with Bonferroni post-hoc analysis as appropriate.

