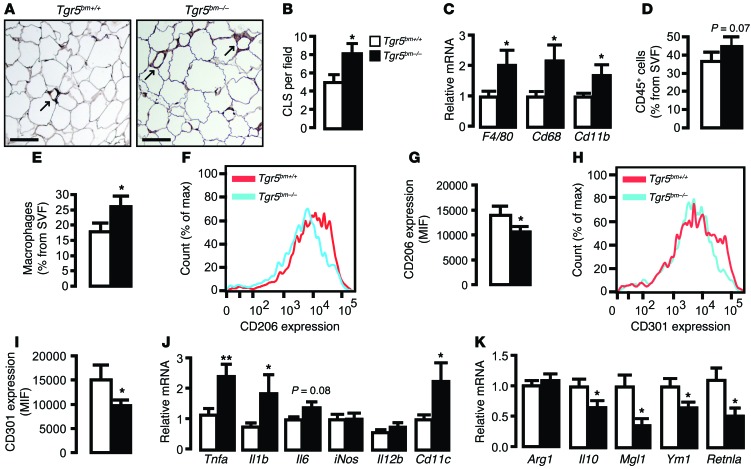
Figure 2. Exacerbated adipose tissue inflammation in Tgr5bm–/– mice.
(A) Representative F4/80 staining of eWAT of HFD-fed Tgr5bm+/+ and Tgr5bm–/– mice. Arrows denote CLS. Scale bars: 50 μm. (B) Quantification of CLS from A (expressed as mean number per microscopic field). n = 3 per group. (C) mRNA levels of macrophage markers in eWAT of HFD-fed Tgr5bm+/+ and Tgr5bm–/– mice. n = 12 per group. (D–I) FACS analysis showing the percentage of (D) CD45+ leukocytes and (E) of CD11b+F4/80+Ly6G–Siglec-F– macrophages in the SVF of eWAT from HFD-fed Tgr5bm+/+ and Tgr5bm–/– mice. n = 8 per group. (F–I) Representative FACS analysis (F and H) and average mean intensity fluorescence (MIF, n = 8 per group; G and I) of (F and G) CD206 and (H and I) CD301 expression in CD11b+F4/80+Ly6G–Siglec-F– macrophages in eWAT of HFD-fed Tgr5bm+/+ and Tgr5bm–/– mice. (J and K) mRNA levels of (J) proinflammatory M1 and (K) antiinflammatory M2 markers in eWAT of HFD-fed Tgr5bm+/+ and Tgr5bm–/– mice. n = 12 per group. Results represent mean ± SEM. *P < 0.05, **P < 0.01 vs. genotype, 2-tailed Student’s t test.

