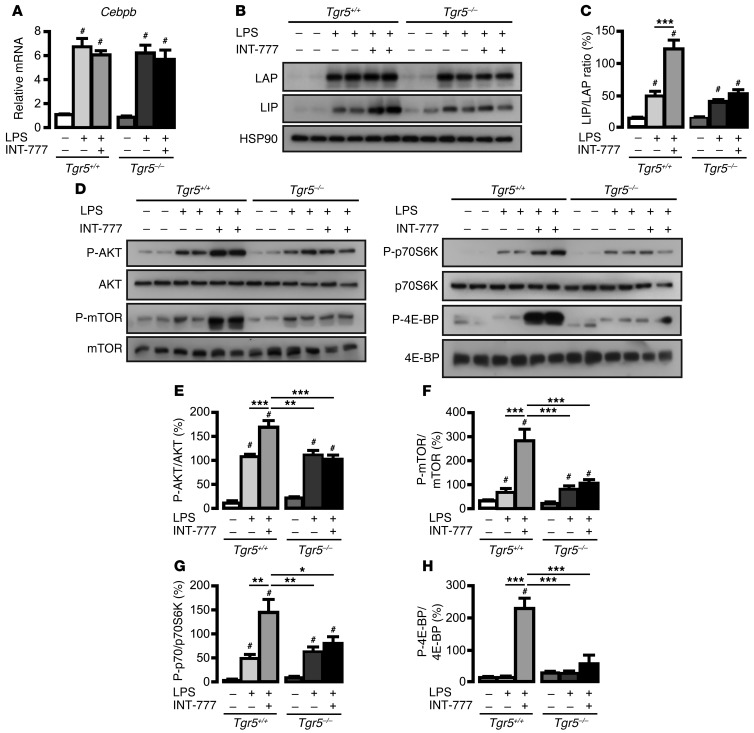
Figure 7. TGR5 activation in macrophages increases the expression of the C/EBPβ-inhibitory isoform LIP.
(A) mRNA levels of Cebpb in primary BMDMs isolated from Tgr5+/+ or Tgr5–/– mice and stimulated with LPS (10 ng/ml) in the presence or absence of INT-777 (30 μM). n = 6 per condition. (B) Western blot of C/EBPβ isoforms (LAP and LIP) and HSP90 in primary BMDMs isolated from Tgr5+/+ or Tgr5–/– mice and stimulated with LPS (10 ng/ml) for 8 hours in the presence or absence of INT-777 (30 μM). (C) LIP/LAP ratio, calculated by densitometry of Western blots in B. n = 6 per group. (D) Western blot of the AKT-mTOR signaling pathway in primary BMDMs isolated from Tgr5+/+ or Tgr5–/– mice and stimulated with LPS (10 ng/ml) for 8 hours in the presence or absence of INT-777 (30 μM). (E–H) Quantitative densitometry of Western blots in D. n = 6 per group. Results represent mean ± SEM. *P < 0.05, **P < 0.01, ***P < 0.001 vs. genotype; #P < 0.001 vs. control, 1-way ANOVA with Bonferroni post-hoc analysis.

