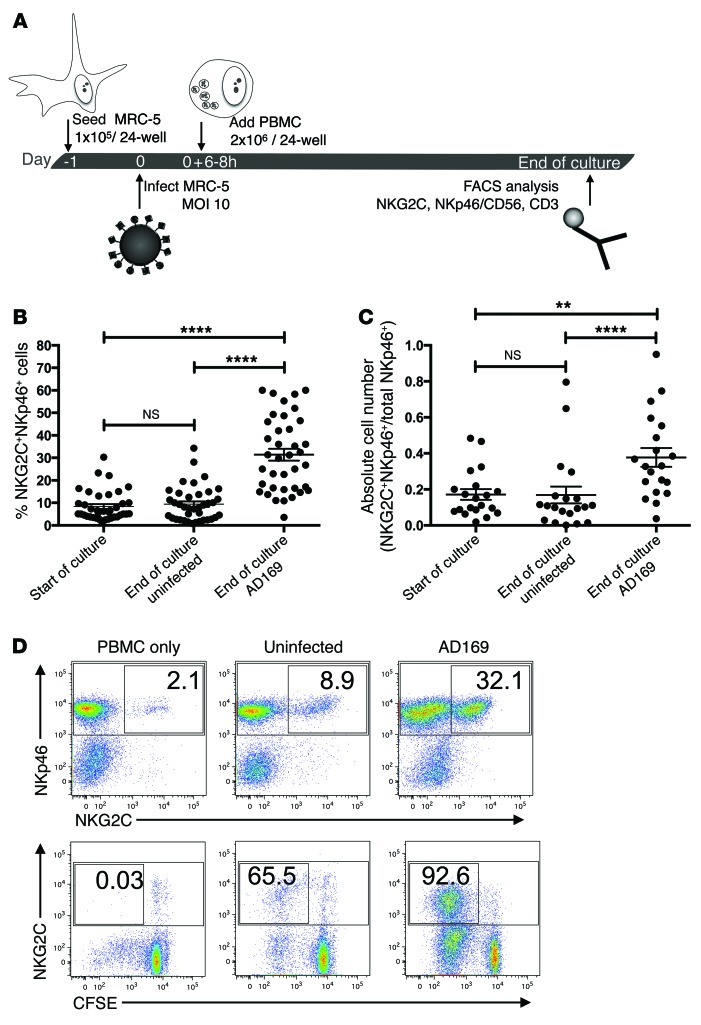
Figure 1. NKG2C+ NK cells expand in response to HCMV-infected fibroblasts.
(A) MRC-5 fibroblasts were infected with HCMV strain AD169 at an MOI of 10 or left untreated. PBMCs were added 6 to 8 hours p.i. to uninfected or infected fibroblasts and cocultured for 8 to 12 days in the presence of 20 U IL-2/ml. (B) Graph depicts the percentage of NKG2C+ cells among all NK cells (NKp46+CD3–) at the indicated time points. Wilcoxon matched pairs signed-rank test, ****P ≤ 0.0001; n = 38; error bars indicate ± SEM. (C) Graph depicts the normalized absolute cell numbers of NKG2C+NKp46+ cells at the indicated time points. Wilcoxon matched pairs signed-rank test, **P = 0.0017, ****P ≤ 0.0001; n = 20; error bars indicate ± SEM. (D) Representative example of NK cell phenotype at day 10 p.i. CFSE-labeled PBMCs cultured alone, with uninfected, or with infected MRC-5 fibroblasts were stained for NKp46, NKG2C, and CD3 at day 10 and analyzed by flow cytometry. Dot plots were gated on live CD3– cells. Numbers indicate the percentage of NKG2C+ cells among all NKp46+ cells (upper panels) or the percentage of NKG2C+CFSE– cells among all NKp46+ cells (lower panels).

