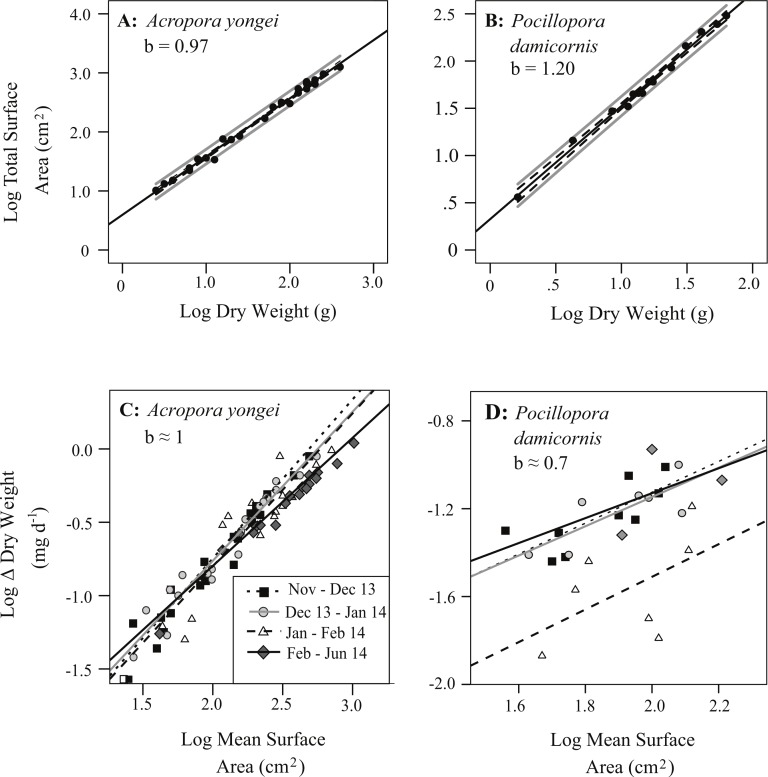
Figure 7. Relationships between the mass and surface area of coral colonies.
Log of total colony bioactive surface area versus log of dry weight for (A) Acropora yongei, and (B) Pocillopora damicornis. The best fit linear regression of the type y = mx + b (black line), the 95% confidence intervals for the fitted regression (dashed) and regression predictions (solid grey) are shown. Log difference (Δ) in dry weight (mg d−1) versus log surface area (cm2) during four different growth intervals for (C) A. yongei and (D) P. damicornis at Salmon Bay, Rottnest Island.

