Figure 1.
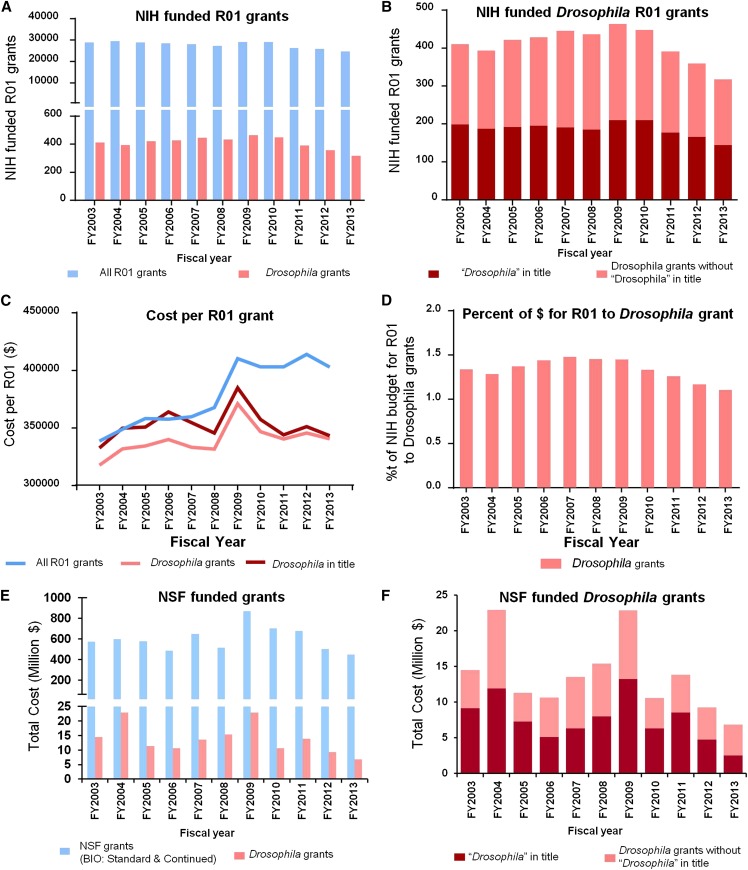
Funding for Drosophila research is in decline. (A) The total number of NIH funded R01 grants (blue bars) and total Drosophila R01 grants (pink bars) shown by fiscal year. The raw data were obtained from the NIH ExPORTER (http://exporter.nih.gov). The total Drosophila grants were manually selected from lists of R01 grants with the word “Drosophila” in either the grant title or the abstract. (B) Number of funded NIH R01 grants comparing those with “Drosophila” in the title (red bars) vs. Drosophila grants without that word in the title (pink bars). (C) The average cost per funded R01 grant for all R01 grants (blue line), those with Drosophila in the title (red line), and the total Drosophila grants (pink line). The cost shown incorporates the cost of supplements for these R01 grants indexed under the same project number. (D) The percentage of the NIH budget that is spent on R01 grants going to Drosophila grants. (E) NSF “standard grant” and “continuing grant” from the Directorate for Biological Sciences (BIO) across fiscal years. The raw data were obtained from the NSF website (http://www.nsf.gov/awardsearch/). The total Drosophila grants were manually selected as for the NIH. (F) NSF Drosophila grants with the word “Drosophila” in the title (red bars) vs. those without (pink bars).

