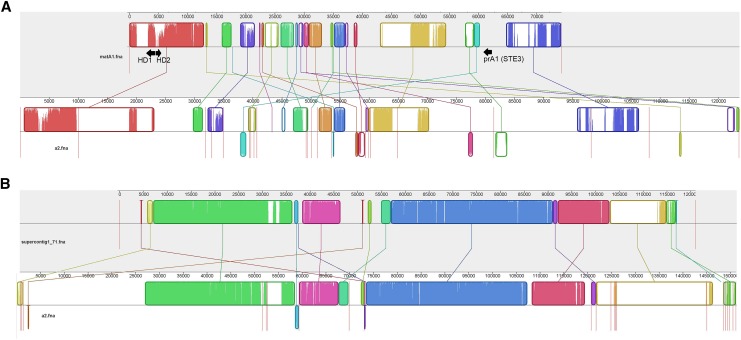
Figure 2.
Alignment of selected mating-type A1-linked scaffolds to the A2 genome. Curved colored blocks represent collinear regions of homology between the genomes (connected by lines) and regions outside such blocks lack detectable homology between the aligned genome sequences. Inside each block are local sequence similarity profiles, with the heights of the color bars being inversely proportional to average entropy of alignment columns in the region. The color in the blocks is arbitrary. Red vertical lines indicate the boundaries of genomic scaffolds. (A) The alignment of the matA1 scaffold to homologous regions in the A2 genome; arrows indicate homeodomain and pheromone receptor loci. (B) The alignment of lam1 supercontig1.71 (longest SR scaffold in lam1 genome) with homologous regions in the A2 genome. The extent of colinearity and sequence similarity between the two mating types is much higher for this region compared to the matA1 region (A). For alignments of the full genomes and the NSR contigs see Figure S3.

