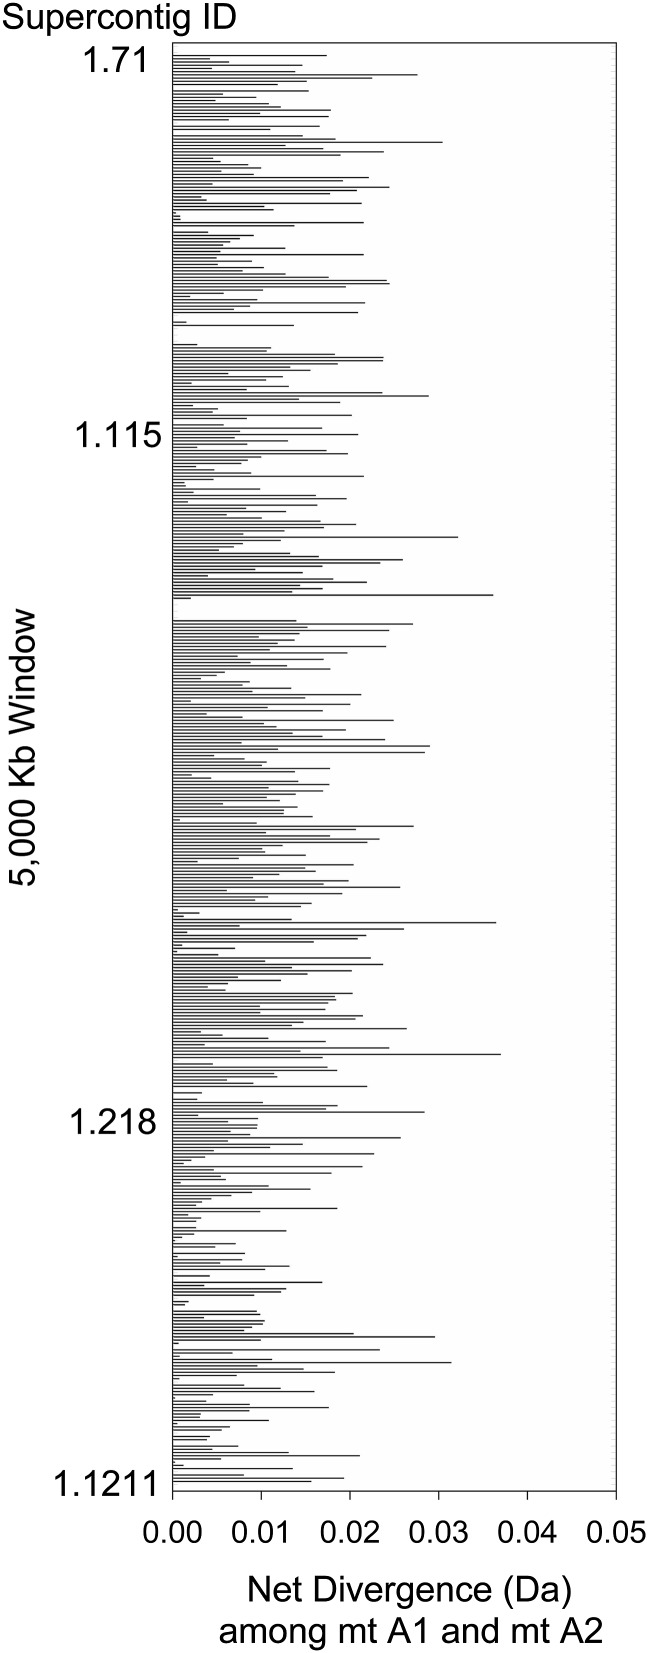
Figure 3.
The values for net divergence (Da) between the two mating types in the SR region. The value of Da is shown for each of the 5000-bp windows based on six strains of M. lychnis-dioicae sequenced for each of the mating types. Each bar represents the value for one window. The order of supercontigs from top to bottom of this figure is listed in Table S1 (ranked by supercontig size—the largest on top).

