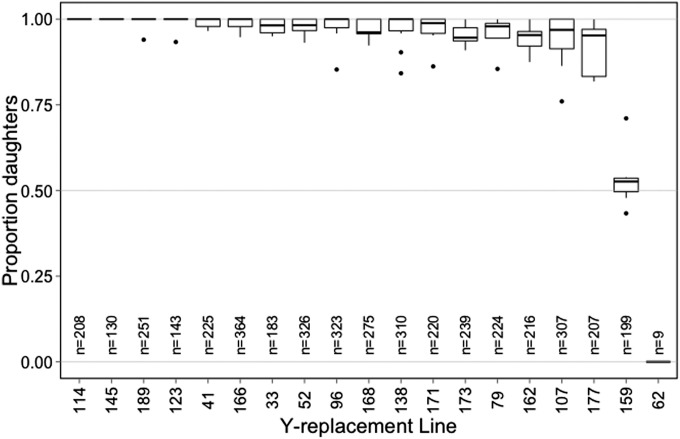
Figure 1.
Two Y-replacement lines show resistance to sex-ratio distortion from XSR. Boxplots for sex ratio of offspring sired by males with XSR and one of several Y chromosomes. Boxes represent first and third quartile and median (bold line), whiskers extend to 1.5 times the interquartile range for each genotype, and outliers are denoted by open circles. Total offspring sired by each genotype is also noted.

