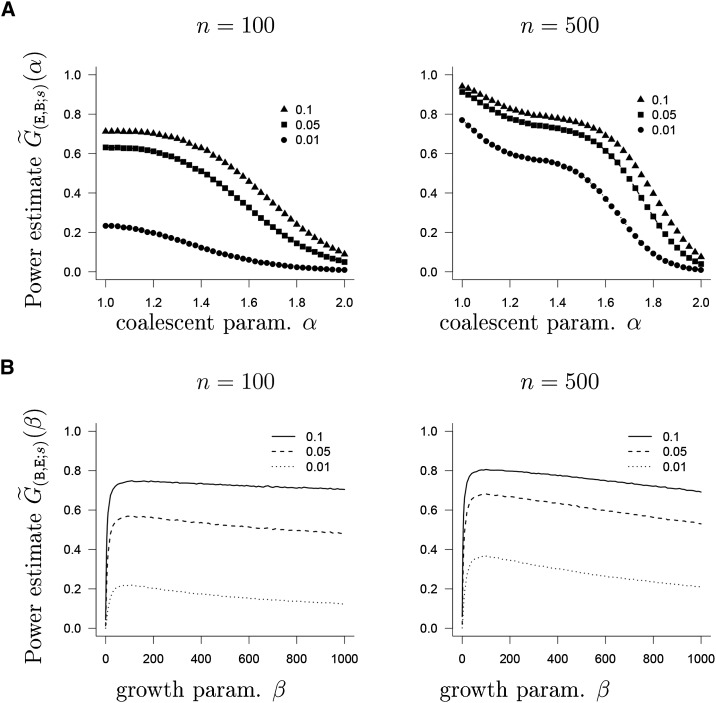
Figure 2.
(A) Estimate of from Equation 10 based on the approximate likelihood from Equation 12 as a function of α (no lumping) with number of leaves n as shown and s = 50. (B) Estimate of from Equation 10 based on the approximate likelihood from Equation 12 as a function of β (no lumping) with number of leaves n as shown and s = 50. The symbols denote the size of the test, as shown in the legend. The interval hypotheses are discretized to and. . In A, the beta(2 − α, α)-coalescent is the alternative; in B, exponential growth is the alternative.

