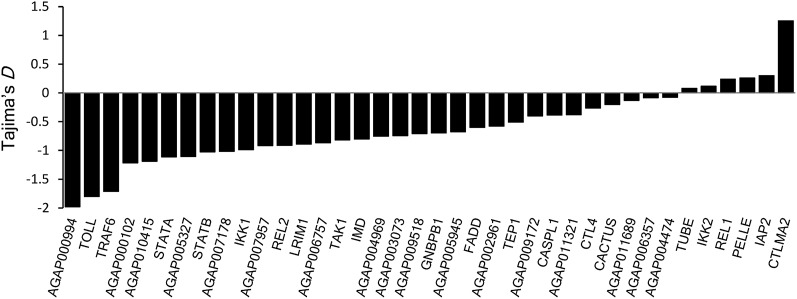
Figure 1.
Distribution of Tajima’s D across all 37 genes. Tajima’s D was calculated for each gene using silent sites and plotted as a histogram showing deviation from neutral expectations. Loci are ordered based on the value of D to draw attention to the contrast between CTLMA2 and the rest of the dataset.

