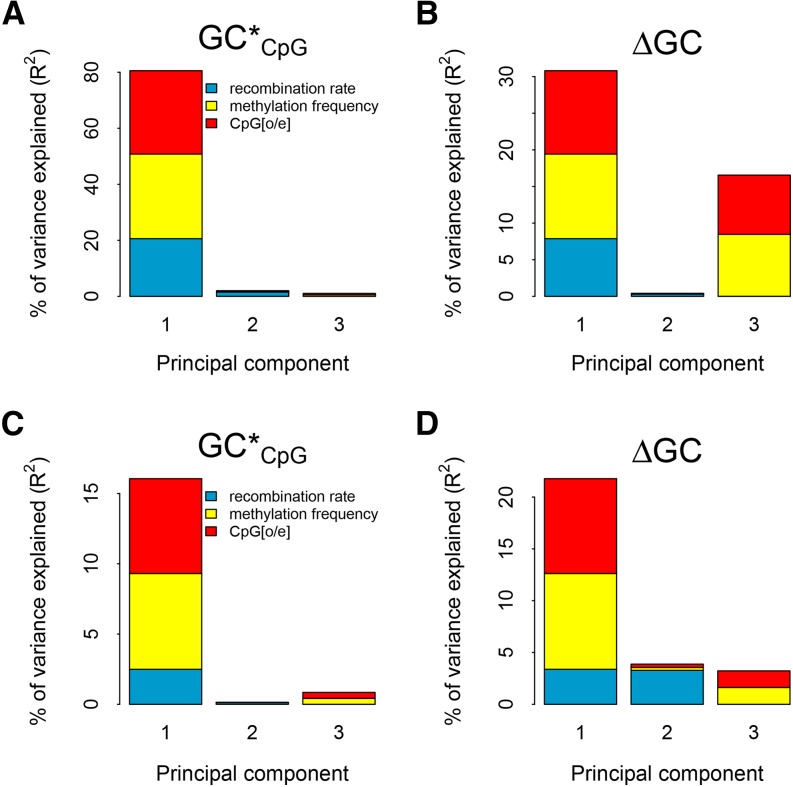
Figure 2.
Amount of variation in GC*CpG as well as ΔGC explained by the different explanatory variables based on principal component regression analysis (panels A and B for chicken and panels C and D for human, respectively). The height of each bar represents how much of the variance in GC* or ΔGC, respectively, is explained by the corresponding principal component. The size of each colored area is proportional to the relative contribution of the respective genomic feature within each principal component.

