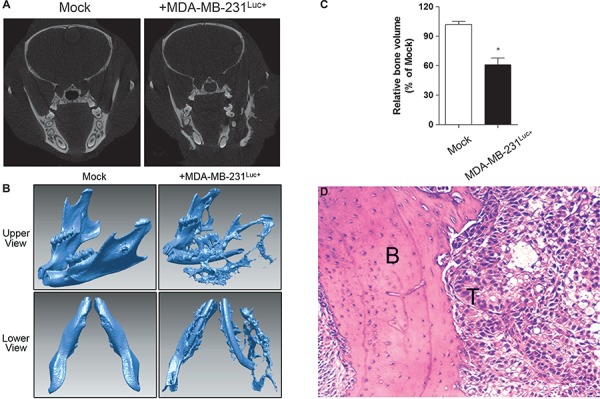
Figure 2. Mandible bone analysis. Radiographic images of mandibles in mice were scanned by mCT at 6 weeks. The osteolytic lesions were analyzed on vertical projection (slice) (A); and 3-D reconstruction images (B; upper and lower view each). The bone volume was determined from processed images shown in 3-D images (B); with the same given diameter (C). Data are expressed as the mean±standard error (SEM). *P<0.01 versus Mock group. Hematoxylin & eosin staining around the mandibular region was performed and the tumor-induced osteolytic site was observed. (original magnification ×100) (B; bone, T; tumor) (D).

