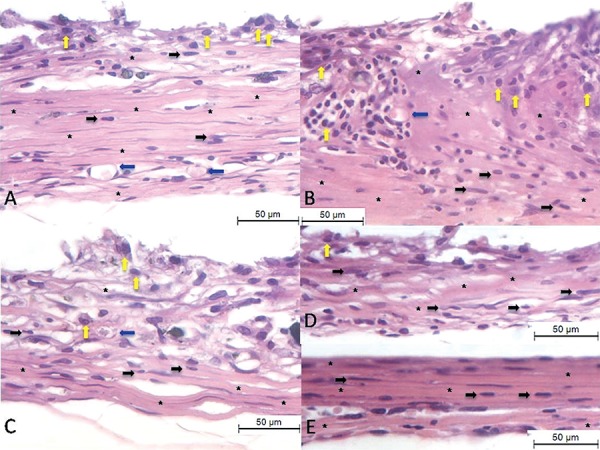
Figure 2. Histological images of inflammatory cells infiltration at the end of implanted tubes at the end of the 60-day period. (A) GMTA. (B) WPC. (C) GPC Minetti. (D) GPC Votoran. (E) Control group. Presence of collagen fibers arranged to the cement (asterisks), fibroblasts (black arrows), blood vessels (blue arrows) and macrophages/multinucleated giant cells (yellow arrows). Hematoxylin and eosin staining, bars represent 50 µm.

