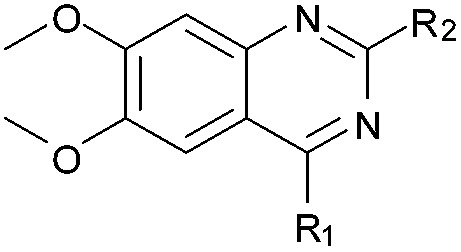
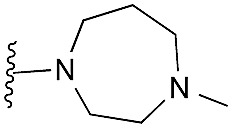
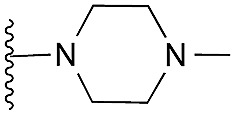
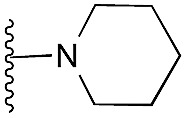
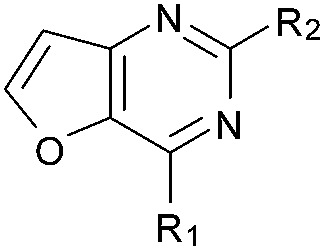
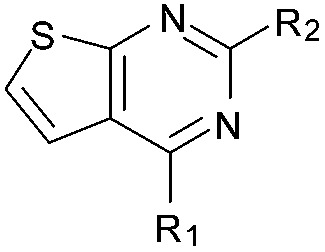
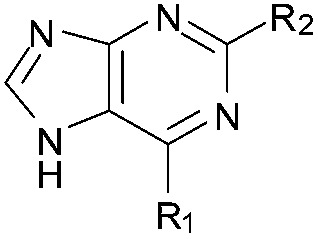
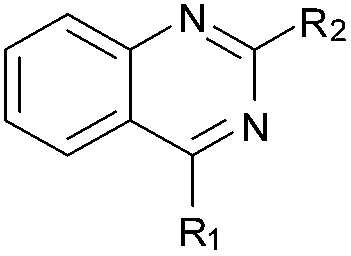
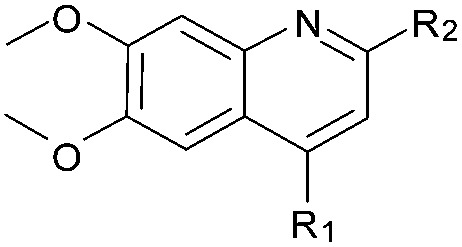
Table 1. SAR, biological and computational results of the BIX-01294 derivatives a .
| Compound ID | Scaffold | R2 | Activity% compound
b
(μM) |
IC50 c (μM) | c log P d | N-1 pK a e | Docking score (kcal mol–1) |
|||
| 50 | 10 | 1 | SP | XP | ||||||
| 1 (BIX-01294) |
|
|
6 | 6 | 11 | 0.067 ± 0.003 | 3.9 | 8.13 (±2.22) | –7.859 | na |
| 2 (HKMTI-1-005) |
|
5 | 6 | 19 | 0.101 ± 0.010 | 3.5 | 5.60 (±2.22) | –6.995 | –6.380 | |
| 3 (HKMTI-1-022) |
|
7 | 9 | 35 | 0.472 ± 0.017 | 4.7 | 7.47 (±1.47) | –5.789 | –4.244 | |
| 4 (HKMTI-1-011) |
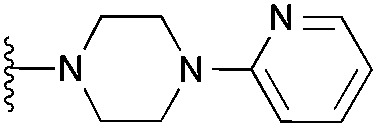
|
15 | 31 | 79 | 3.190 ± 0.080 | 4.4 | 8.10 (±1.47) | na | na | |
| 12 |
|
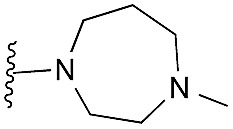
|
99 | 102 | 99 | — | 2.9 | 4.57 (±0.70) | na | na |
| 13 |
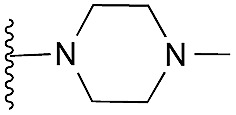
|
98 | 100 | 107 | — | 2.5 | 4.66 (±0.70) | na | na | |
| 14 |
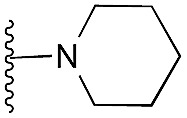
|
97 | 96 | 101 | — | 3.7 | 5.31 (±0.70) | na | na | |
| 15 |
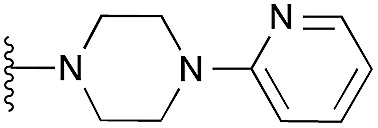
|
102 | 98 | 107 | — | 3.4 | 5.77 (±0.70) | na | na | |
| 16 |
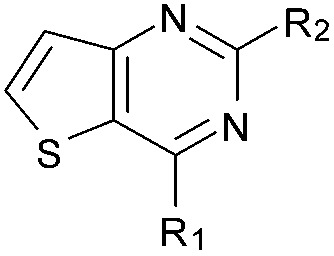
|
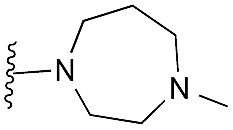
|
47 | 82 | 91 | — | 3.9 | 5.68 (±0.70) | na | na |
| 17 |
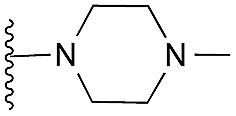
|
62 | 83 | 105 | — | 3.5 | 5.77 (±0.70) | na | na | |
| 18 |
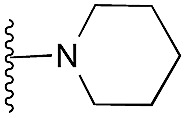
|
91 | 102 | 114 | — | 4.8 | 6.42 (±0.70) | na | na | |
| 19 |
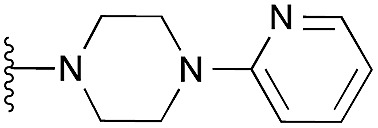
|
104 | 105 | 98 | — | 4.5 | 6.88 (±0.70) | na | na | |
| 20 |
|
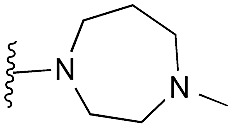
|
81 | 96 | 91 | — | 3.9 | 3.28 (±2.22) | na | na |
| 21 |
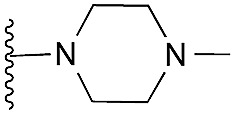
|
88 | 92 | 105 | — | 3.5 | 3.35 (±2.22) | na | na | |
| 22 |
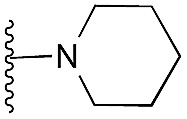
|
93 | 105 | 105 | — | 4.8 | 3.86 (±2.22) | na | na | |
| 23 |
|
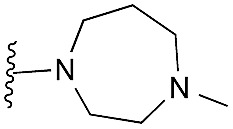
|
67 | 90 | 101 | — | 2.6 | 3.15 (±2.22) | na | na |
| 24 |
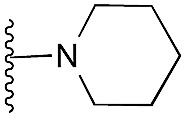
|
101 | 90 | 97 | — | 3.4 | 3.73 (±2.22) | na | na | |
| 25 |
|
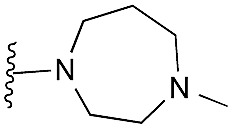
|
55 | 84 | 96 | — | 3.2 | 6.62 (±0.70) | na | na |
| 31 |
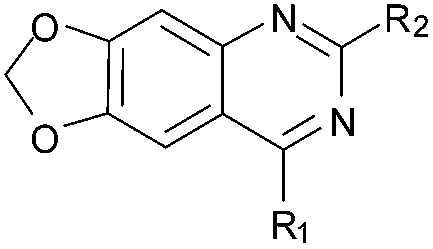
|
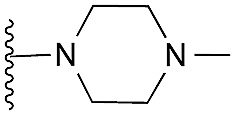
|
63 | 91 | 98 | — | 3.2 | 5.58 (±2.22) | na | na |
| 32 |
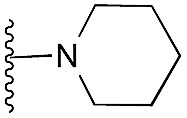
|
78 | 95 | 96 | — | 4.4 | 7.45 (±1.47) | na | na | |
| 33 |
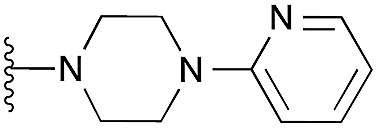
|
109 | 98 | 96 | — | 4.2 | 8.08 (±1.47) | na | na | |
| 34 |
|
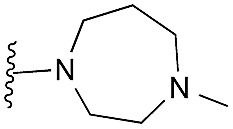
|
18 | 46 | 93 | — | 3.8 | 8.06 (±2.22) | na | na |
| 35 |
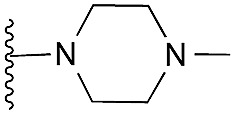
|
27 | 59 | 94 | — | 3.5 | 5.53 (±2.22) | na | na | |
| 36 |
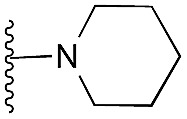
|
72 | 82 | 94 | — | 4.7 | 7.40 (±2.22) | na | na | |
| 37 |
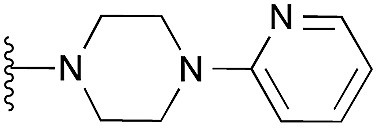
|
97 | 108 | 104 | — | 4.4 | 8.03 (±2.22) | na | na | |
| 41 (HKMTI-1-248) |
|
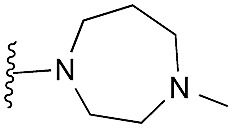
|
5 | 4 | 6 | 0.013 ± 0.001 | 4.5 | 10.57 (±2.22) | –7.522 | –6.904 |
| 42 (HKMTI-1-247) |
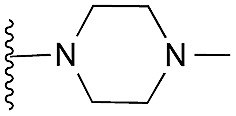
|
5 | 6 | 7 | 0.031 ± 0.003 | 4.1 | 9.84 (±2.22) | na | –6.476 | |
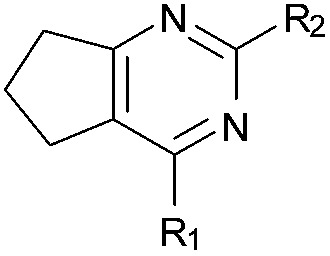
aR1 is the same for all compounds: R1 = 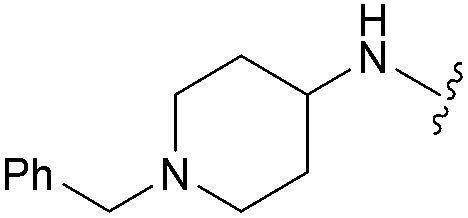 , SP = standard precision mode, XP = extra precision mode, na = no desired pose found.
bThe experiment was conducted in duplicate.
cThe assay was conducted in triplicate at K m of both substrates (0.8 μM peptide [H3 1–25] and 8 μM SAM) for G9a (5 nM).17
d c log P values were calculated using the freely available program RDkit.34
e‘Sequential’ pK a values were calculated at pH 7.0, with water as the solvent model, using the Epik 2.7 program implemented in Schrodinger (see ESI).
