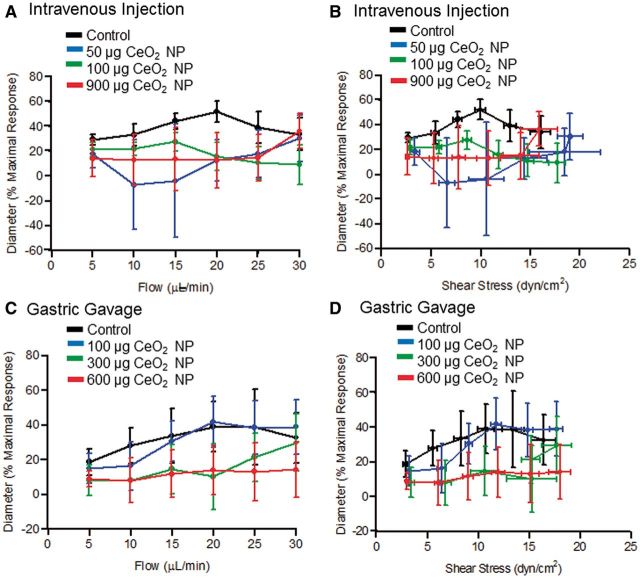
FIG. 4.
The left panels are vasodilation in response to increases in intraluminal flow following intravenous injection (A, n = 5–10) and gastric gavage (B, n = 6–8) of CeO2 NP. The right panels are vasodilation in response to increasing shear stress following intravenous injection (C, n = 6–10) and gastric gavage (D, n = 6–8) of CeO2 NP. *p ≤ 0.05 versus control.

