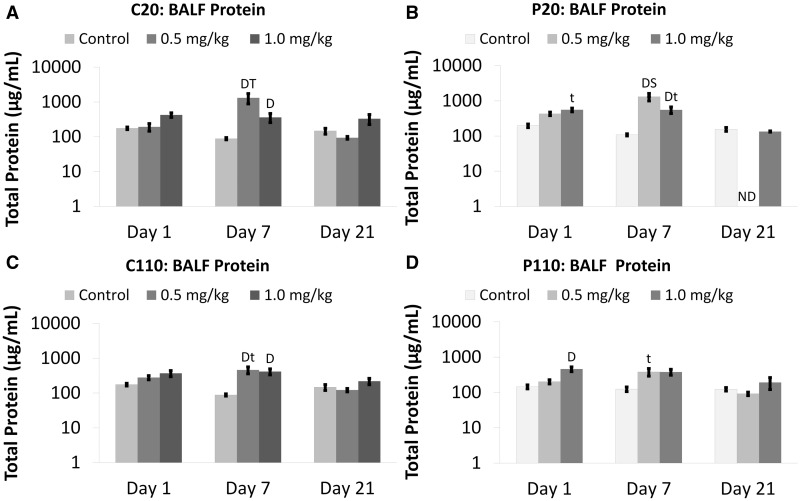
FIG. 2.
Citrate- and PVP-coated Ag NPs increase total BALF protein. Panels show total protein Days 1–21 post IT of C20 (A), P20 (B), C110 (C), or P110 (D). Results are from ANOVA considering the interaction between dose, time, and Ag NP coating and size. Analyses were run at P ≤ 0.05 with log-transformed values and presented (above) on log scales. “D”—difference from the sham control group (same panel, same day). “T”—differences from multiple groups (same panel, same dose, different days). “t”—difference from Day 21 only (same panel, same dose). “S”—difference from a group given Ag NPs of a different size (different panel, same day). “ND”—no data.

