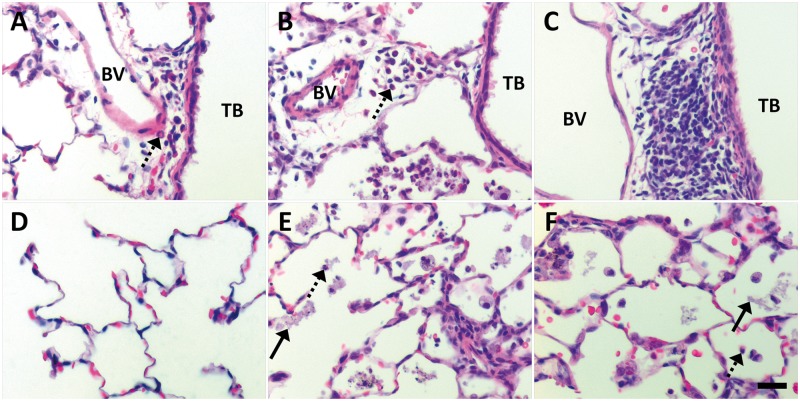
FIG. 8.
Extravasation and destruction of phagocytic macrophages and PMNs at Day 7 post IT of citrate or citrate-coated Ag NPs. Panels are brightfield microscopy images contrasting the most severe responses in H&E-stained tissue sections, from rats instilled with a single dose of 1.0 ml/kg citrate buffer (sham control [A, D]), C20 (B, E), or C110 (C, F). Broken arrows indicate PMNs influxing from BVs to sub-epithelial regions of the TBs (A–C), or collecting in alveolar airspaces (D–F). Solid arrows show cellular exudate resulting from Ag NP exposure. Scale bar is 25 µm.

