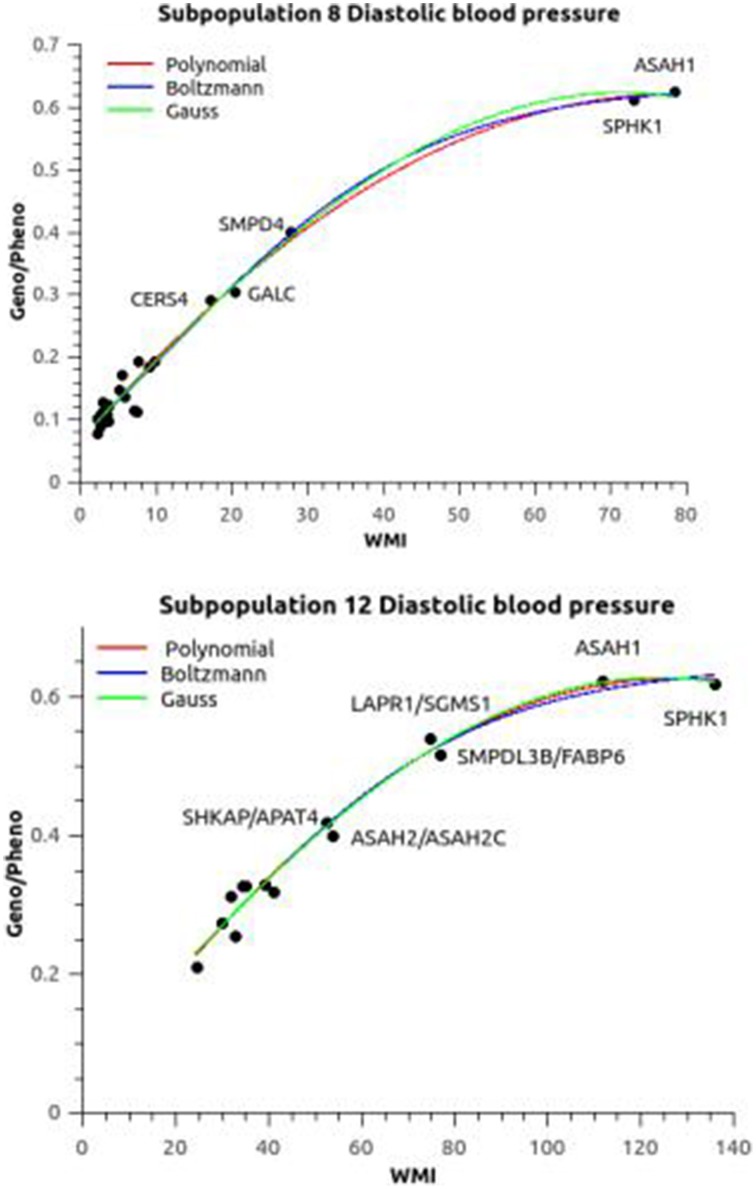
Figure 3.
Association between relative epistasis and WMI. The plots shows the heritability (Geno/Pheno) of the diastolic blood pressure as a function of the weighted mutual information (the plots of systolic blood pressure are similar). Subpopulation 8 was evaluated at an allocation threshold of 0.7 in contrast to 0.9 for all the other subpopulation (see Text for discussion). The three fitted plots [polynomial, Boltzmann (sigmoid), and Gaussian] were almost overlapping. Apart from the ubiquitous ASAH1 and SPHK1 haplotypes there is a difference in the ranking of the next interactions between the subpopulations. Similar differences in patterns were seen for the other subopulations.

