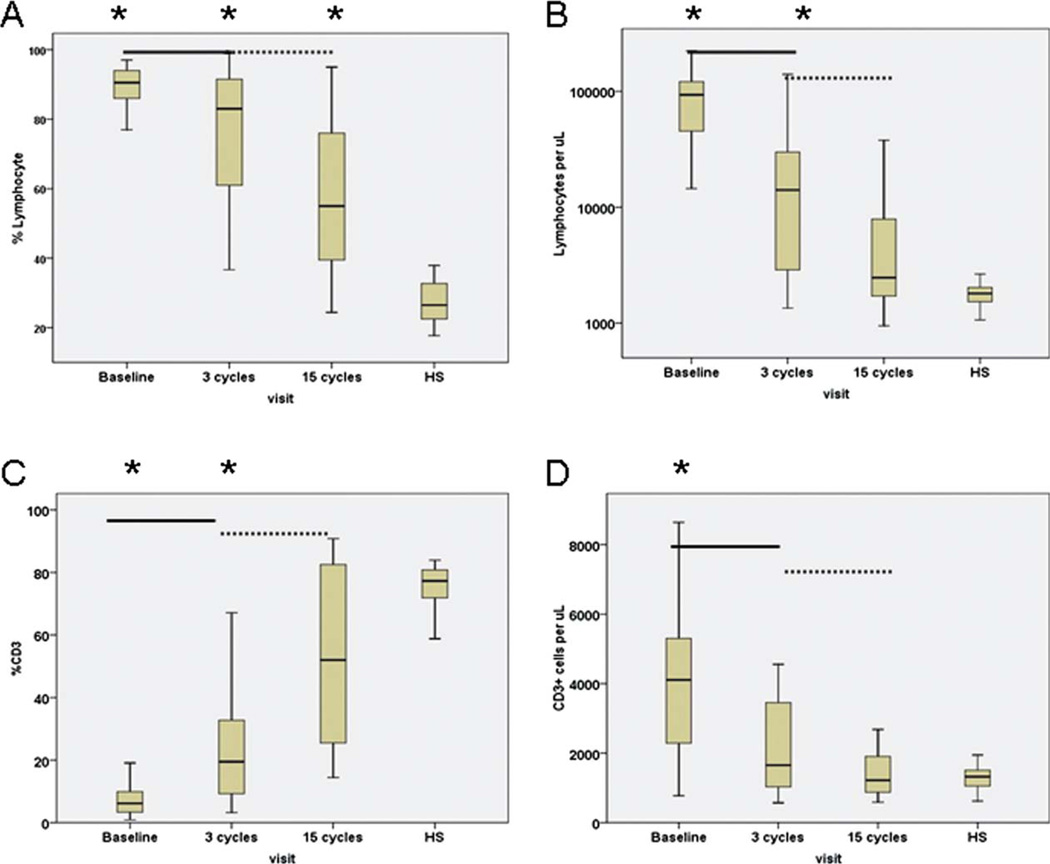
Figure 1.
Decreases in (a) percentages and (b) numbers of lymphocytes and increases (c) in percentage and (d) number of T cells with lenalidomide are shown. Data obtained from healthy subjects (HS) are shown on the right side of each figure. Asterisks represent significant differences between healthy subjects and those of CLL patients at the designated time points during treatment. Solid line represents significant differences between pretreatment versus after 3 cycles of therapy; dashed line represents significant differences between after 3 cycles versus after 15 cycles of therapy.

