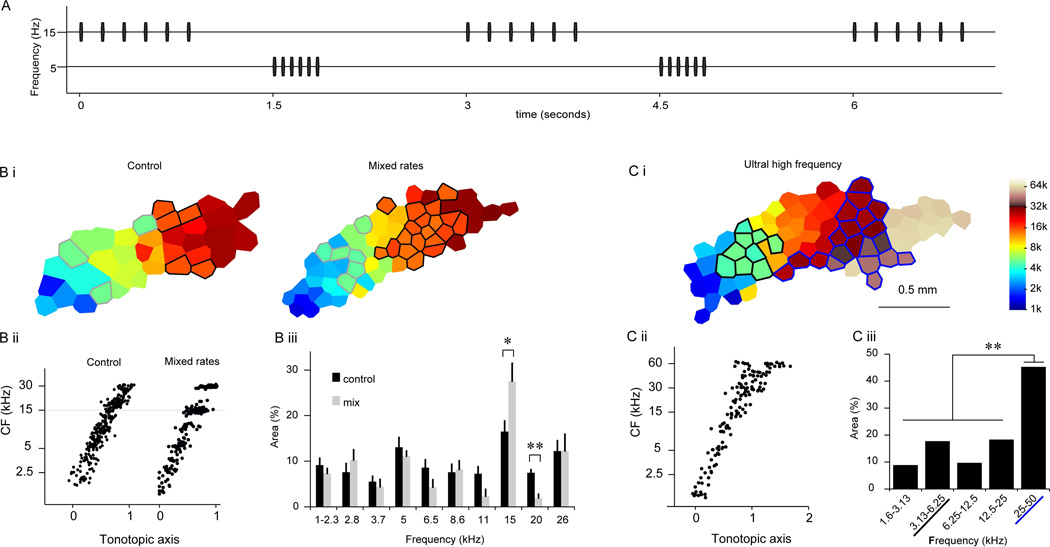
Figure 1. Over-representation of sounds repeated at the ethological rates.
A, A schematic of “mix-rate” rearing stimuli. A train of 15-kHz tone consisted of six tone pips presented at the Ethological rate (6 Hz), and a train of 5-kHz tone consisted of six tone pips presented at the Fast rate (15 Hz). Trains of the two repetition rates were interleaved such that one train was heard every 1.5 seconds. B. CF map reorganization resulted from the mixed-rate rearing. Bi. Example maps of control and mixed-rate animals. Control animal is the same as seen in Figure 2A. Area represented 5 kHz ± 0.2 octaves are outlined in gray while area representing 15 kHz ± 0.2 octaves are outlined in black. Bii. Distributions of CFs along the tonotopic axis. Biii. Sizes of cortical areas representing different frequency bands. There was a significant increase in representation at 15 kHz and a significant decrease at 20 kHz. C. Cortical representation of ultrasonic frequencies. Ci. An example CF map from a control animal mapped up to 74 kHz. Areas representing 25–50 kHz are outlined in blue while areas representing 3.13–6.25 kHz are outlined in black. Cii. Distribution of CFs along the tonotopic axis. Ciii. Sizes of cortical areas representing one-octave frequency bands. The representation of the 25–50 kHz band was significantly larger than those of the other. Error bars depict standard error of the mean. * indicates p < 0.05, ** indicates p < 0.001. This figure was originally published in (Kim & Bao, 2009).

