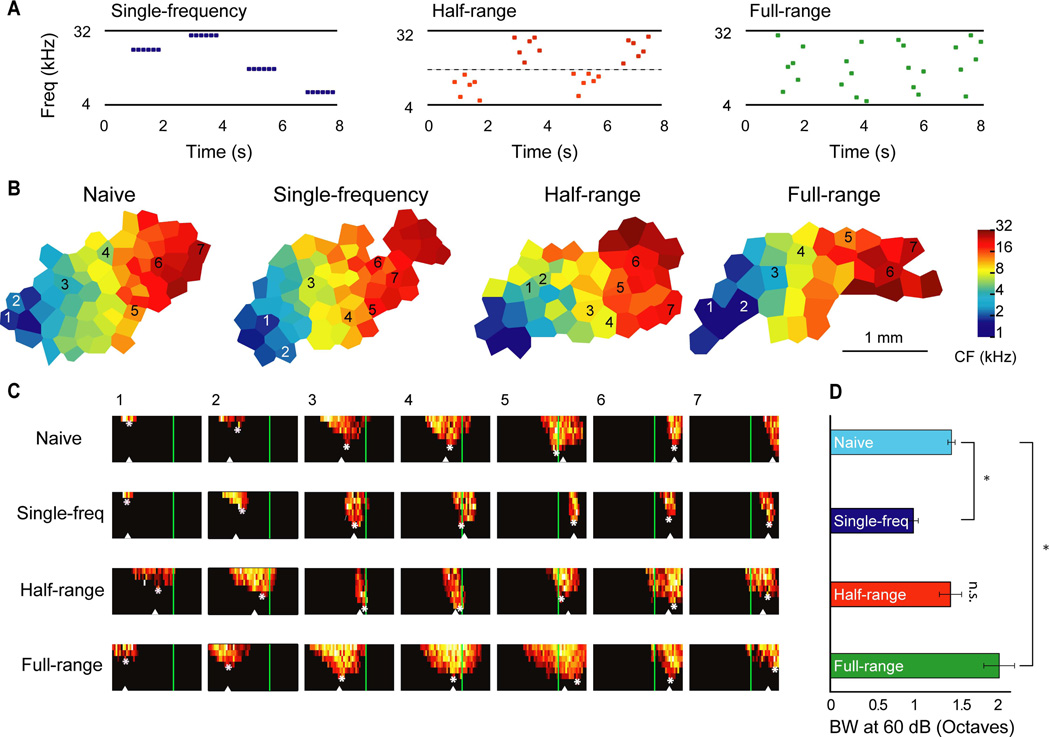
Figure 2. Influences of higher-order stimulus statistics on spectral selectivity of primary auditory cortical neurons.
A. Schematics of the acoustic environments that the animals experienced. The three acoustic environments had the same logarithmically uniform frequency distribution from 4–32kHz and the same temporal presentation rates, but differed in the conditional probabilities of the tonal frequencies within sequences. B. Representative cortical maps. The sound exposure did not alter the overall tonotopic characteristic frequency distribution. C. Representative frequency-intensity receptive fields. The corresponding locations are marked on the tonotopic maps in B. The green vertical lines mark the low conditional probability boundary experienced by the half-range group. Stars denote the characteristic frequency (CF) and triangles denote the center-of-mass frequency. Horizontal axis depicts frequency logarithmically from 1 to 32 kHz and vertical axis depicts intensity from 10 to 80 dB SPL. D. Tuning bandwidth at 60 dB SPL. Cyan = naïve control, dark blue = single-frequency, red = half-range, green = full-range. Frequency tuning bandwidth became narrower in the single-frequency group and broader for the full-range group compared to control. Error bars depict standard error of the mean. * indicates p<0.05 determined by an ANOVA with posthoc Tukey-Kramer test. This figure was originally published in (Kover et al., 2013).

