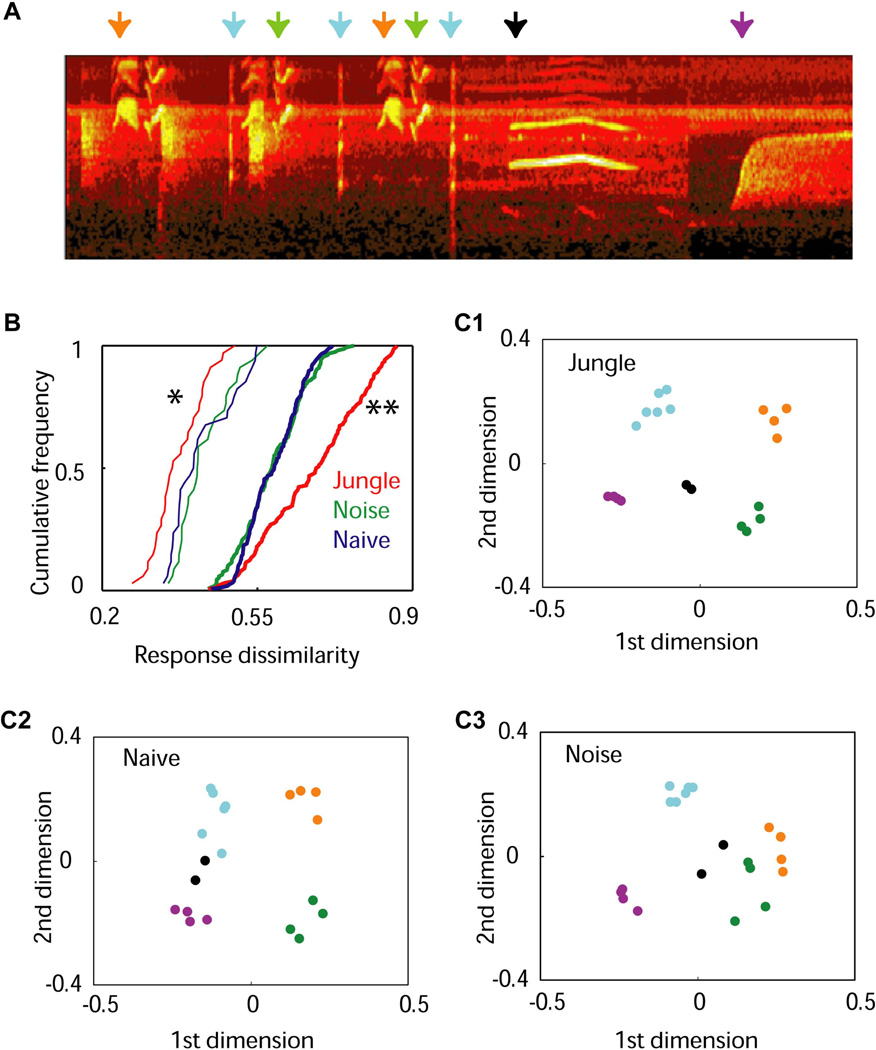
Figure 4. Segregated representations of jungle song motifs instructed by early experience.
A. Spectrogram of a section of the testing jungle sound stimuli (duration, 4.5 s). Arrows with different colors indicate different song motifs. B. Cumulative distributions of response dissimilarities. Dissimilarities between responses to different song motifs were plotted with thick lines, and those to same song motifs were plotted with thin lines. (*, p < 0.05; **, p < 0.005; comparing with the other two groups). C. Similarity relations between responses to jungle sounds. Each dot represents a cortical population-temporal response to a jungle sound. The distances between dots are proportional to the dissimilarity between corresponding responses. The color-coding for song motifs is the same as shown in A. Note that cortical responses to different song motifs were sharply segregated in jungle sounds-experienced animals (p < 0.05). This figure was originally published in (Bao et al., 2013).

