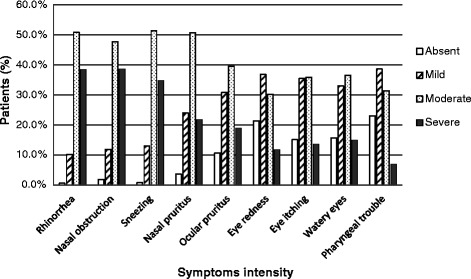
Figure 1.

Intensity of symptoms at entry in the study (n = 3089). The percentage of patients is reported on the vertical axis. Symptoms are reported on the horizontal axis, from left to right: rhinorrhea, a blocked nose, sneezing, nasal pruritus, red eye, eye stinging, watery eye, pharyngeal discomfort. Symptom intensity (absent, mild, moderate, severe) is represented by columns: white columns correspond to absent; hatched columns correspond to mild; dotted columns correspond to moderate; and black columns correspond to severe.
