
Figure 7.
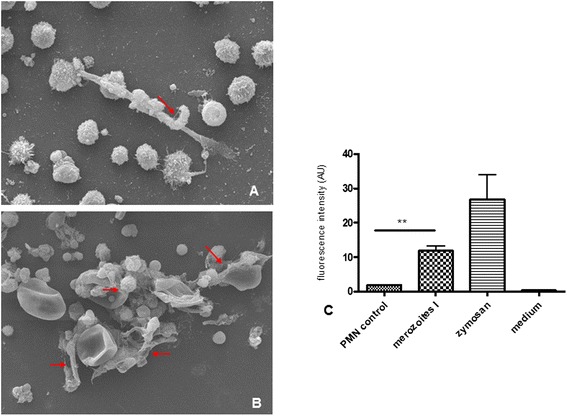
NET formation triggered by E. bovis merozoites I and oocyst stages. (A) Scanning electron microscopy (SEM) analysis of E. bovis merozoite I-exposed PMN. The arrow indicates a merozoite I being trapped in NET structures. (B) SEM analysis of E. bovis oocyst-exposed PMN revealing NET-like, delicate PMN-derived filaroid structures being attached to oocysts as indicated by arrows. (C) Quantification of E. bovis merozoite I-induced NET formation. PMN were exposed to E. bovis merozoites I, zymosan (positive control) or plain medium (negative control). NET formation was estimated by Pico Green-derived fluorescence intensities. Arithmetic means of three PMN donors, minimum and maximum.