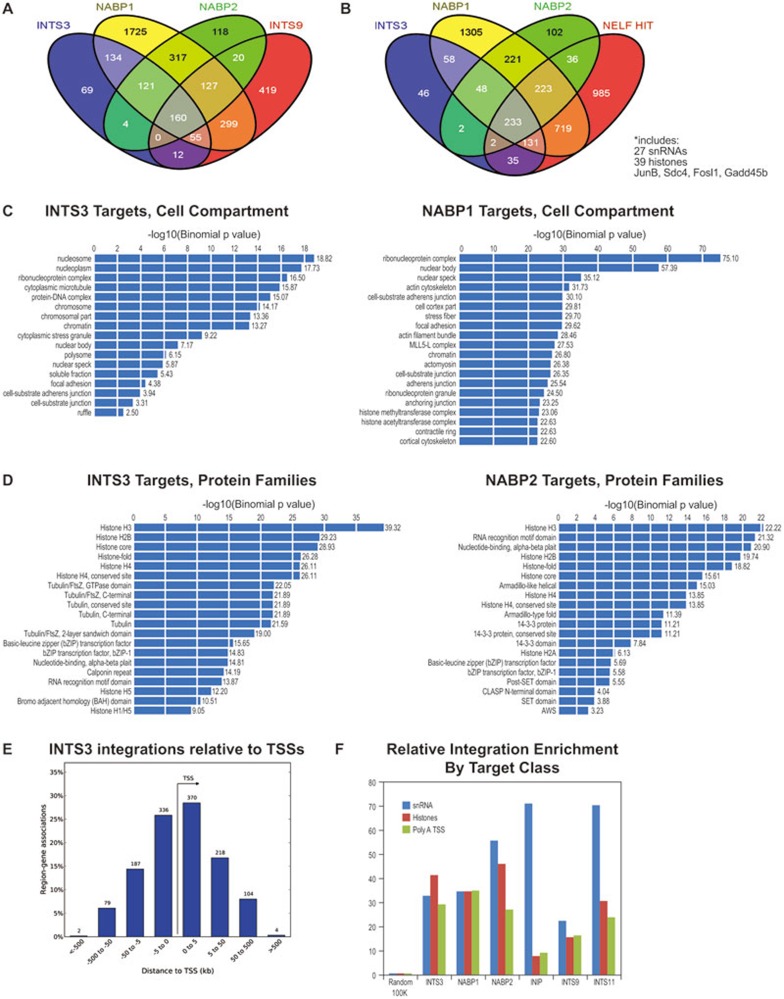
Figure 1.
HIT-Seq analysis of Integrator, NELF and DSIF. (A) INTS3/NABP complexes are functionally associated with Integrator. The Venn diagram shows the intersections of target genes from the INTS3, NABP1, NABP2, and INTS9 HIT-Seq analyses. Target genes were determined by using the intersection tool of the UCSC mouse genome browser, using 2 kb windows containing six integrations as positive hits. Venn diagrams were constructed using Venny. (B) The Integrator complex is functionally associated with NELF. The Venn diagram shows the intersections of target genes from the INTS3, NABP1, NABP2, and a composite NELF (A, B, C, D, and E) HIT-Seq analyses. Target genes were determined by using the intersection tool of the UCSC mouse genome browser, using 2 kb windows containing six integrations as positive hits. Venn diagrams were constructed using Venny. (C) The Integrator complex regulates genes involved in ribonucleoprotein complexes. INTS3 and NABP1 target genes, as defined in A, were analyzed by GREAT for cell compartment. (D) The Integrator complex regulates the histone gene family. INTS3 and NABP1 target genes, as defined in A, were analyzed by GREAT for common protein families. (E) The Integrator complex binds near the transcriptional start sites (TSSs) of genes. Positive target windows, as defined in A, were analyzed by GREAT for their distance relative to TSS. (F) Enrichment scores for directed virus integrations events were calculated for snRNA genes, replication-dependent histone genes, and TSSs of genes with polyadenylated messages using the UCSC mouse genome browser. snRNA, replication-dependent histone, and polyadenylated message tracks were pre-selected using MEF GRO-Seq data to identify expressed genes, and a 700 bp window was extended from the end of the expressed genes for intersection with the HIT-Seq datasets. A track with 100 000 random integrations was used as a control.

