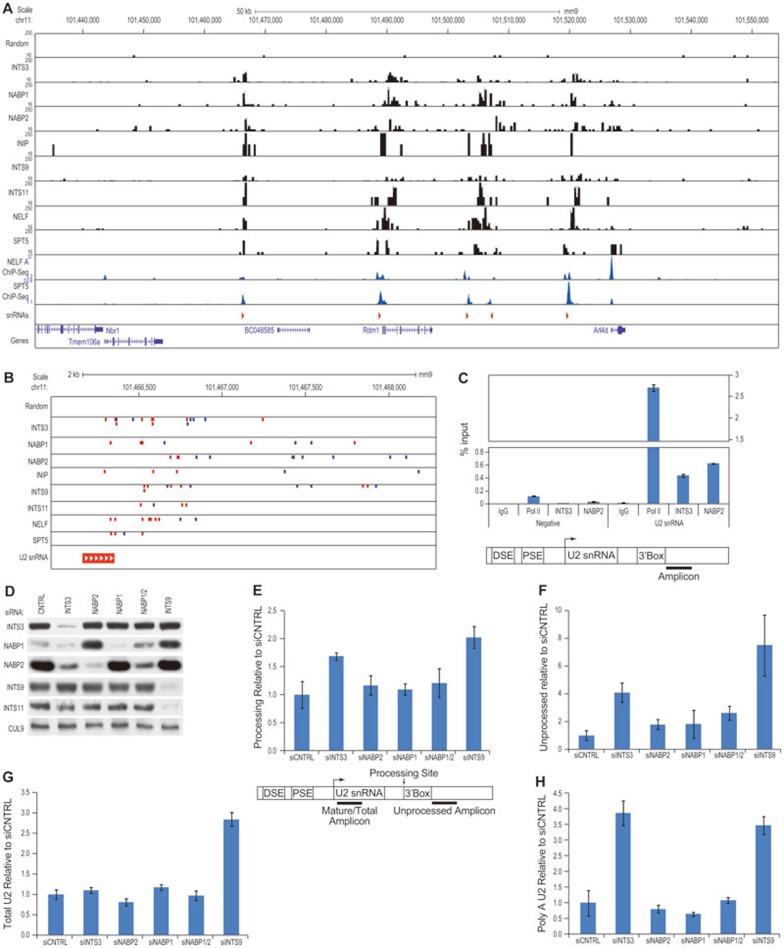
Figure 2.
The INTS3/NABP complexes regulate snRNA genes. (A) Integrator, NELF, and DSIF bind snRNA genes. HIT-Seq data for a 200 kb section of mouse chromosome 11, containing a cluster of snRNA genes. The HIT-Seq data for each construct is presented as counts per kb per million (CPKM). The NELF dataset is a composite of all NELF subunits analyzed by HIT-Seq, and the NELF and SPT5 ChIP-Seq datasets are previously published31. The orientation of snRNA transcription is shown at the bottom. (B) Integrator, NELF and DSIF bind the 3′ region of snRNA genes. A higher magnification of individual virus integrations at a U2 snRNA gene from the chromosome 11 locus is shown to illustrate binding in the 3′ region. Blue and red marks indicate the orientation of each virus integration. (C) ChIP was performed from HeLa cells using the indicated antibodies and was analyzed by qPCR for the indicated amplicon at the U2 snRNA locus (+292 bp relative to the U2 snRNA start;30). A negative control primer in an intergenic region was also analyzed. Error bars show the standard deviation (SD) of three PCR reactions. (D) Western blotting was performed as indicated to show the effectiveness of the siRNA knockdowns. (E) Random primed cDNAs from HeLa cells transfected with the indicated siRNAs were analyzed by qPCR for unprocessed and total U2 snRNA transcripts as adapted from59. The ratio from each sample is presented relative to the control sample. The Data is presented as mean ± SD. The location of the primers is shown below the graph. (F) Random primed cDNAs from HeLa cells transfected with the indicated siRNAs were analyzed by qPCR for unprocessed U2 snRNA transcripts versus an 18S rRNA control. Each sample is presented relative to the control sample. The data is presented as mean ± SD. (G) Total U2 snRNA from HeLa cells transfected with the indicated siRNAs was analyzed by qPCR for the processed form of the U2 snRNA relative to 18S rRNA. Each sample is presented relative to the control sample. The data is presented as mean ± SD. (H) Oligo-dT primed cDNAs from HeLa cells transfected with the indicated siRNAs were analyzed by qPCR for total U2 snRNA transcripts relative to actin. The results are presented relative to the control sample. The data is presented as mean ± SD.

