Figure 5.
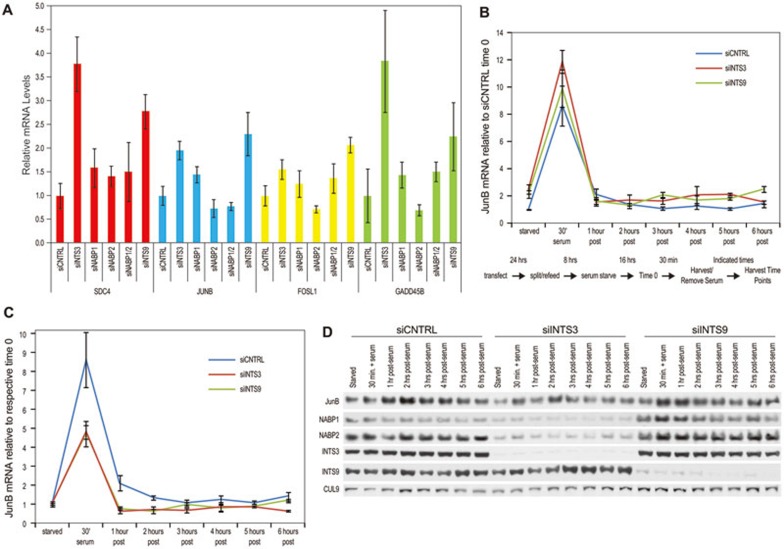
Integrator regulates genes with polyadenylated mRNAs. (A) HeLa cells were transfected with the indicated siRNAs. Oligo-dT primed cDNAs were generated and analyzed by qPCR for the indicated transcripts relative to actin. The results for each gene are presented relative to the control sample. The data is presented as mean ± SD. (B) HeLa cells were transfected with either a control siRNA (siCNTRL), an siRNA against INTS3 (siINTS3), or an siRNA against INTS9. Twenty-four hours posttransfection, cells were split/re-fed, before a 16 h serum starvation (0.1% serum). Serum-starved cells were stimulated for 30 min with 20% serum before removal of serum (0.1% serum). Oligo-dT primed cDNAs were generated and analyzed by qPCR for JUNB relative to actin. All data points are shown relative to the time zero for the control siRNA samples. The data is presented as mean ± SD. A schematic of the serum starvation/stimulation experiment is shown below the graph. (C) The data points from B are shown relative to the time zero for their respective siRNAs. The data is presented as mean ± SD. (D) Western blotting was performed on protein extracts from B as indicated.

