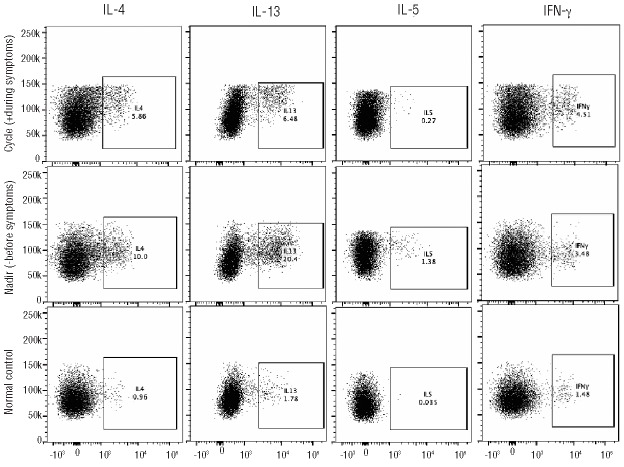
Figure 4.
Variation in intracellular production of IL-4, IL-5, IL-13 and IFN-γ by activated CD4+ lymphocytes in a subject with EAE. After gating on viable CD3+CD4+CD154+ cells, side scatter versus intracellular cytokine (% cells positive) dot plots were generated. Intracellular IL-4, IL-5, IL-13 and IFN-γ levels are shown for subject 1 before and during symptoms (nadir and cycle, respectively) and for a normal control.

