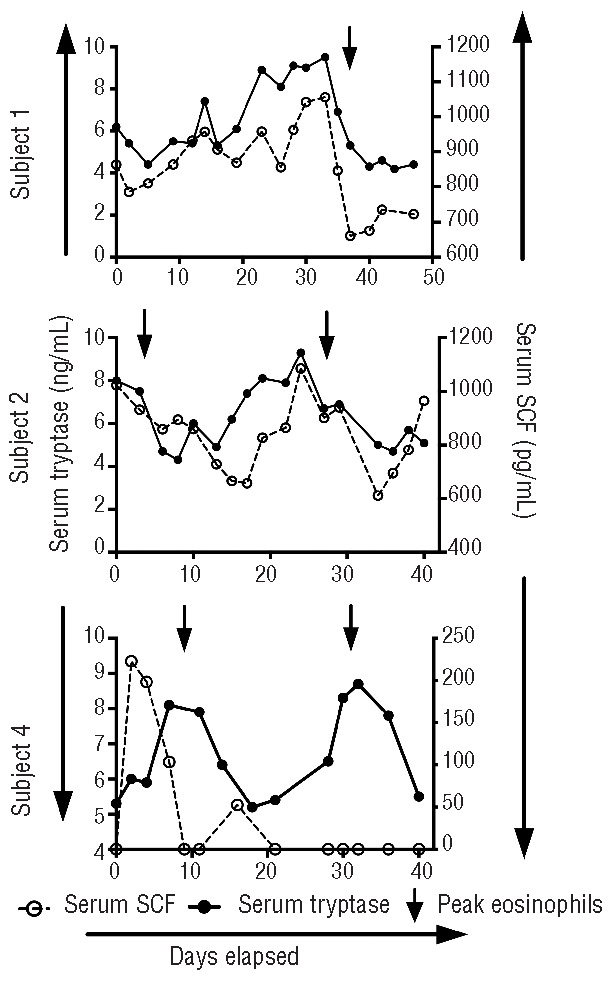
Figure 5.

Cyclic variation of serum tryptase and SCF (limit of detection 9 pg/mL) levels in EAE. Serum levels of tryptase and SCF are shown as a function of time during an entire cycle for three subjects. Symbols represent individual measurements, and an arrow indicates the peak eosinophil count during a cycle.
