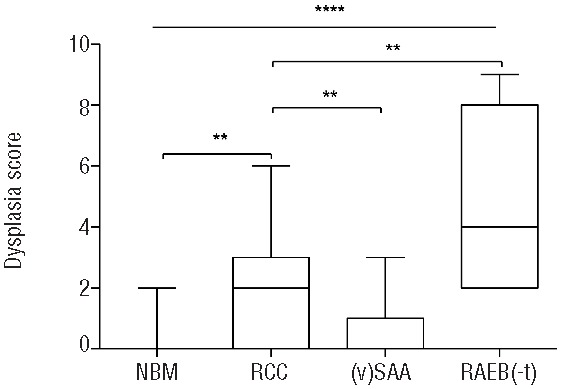
Figure 3.

Number of flow cytometric abnormalities in refractory cytopenia of childhood patients and controls. Lines indicate medians. Boxes extend from the 25th to 75th percentile; lines in the boxes indicate medians, whiskers indicate minimum and maximum values. **P<0.01; ****P<0.0001. NBM: normal bone marrow.
