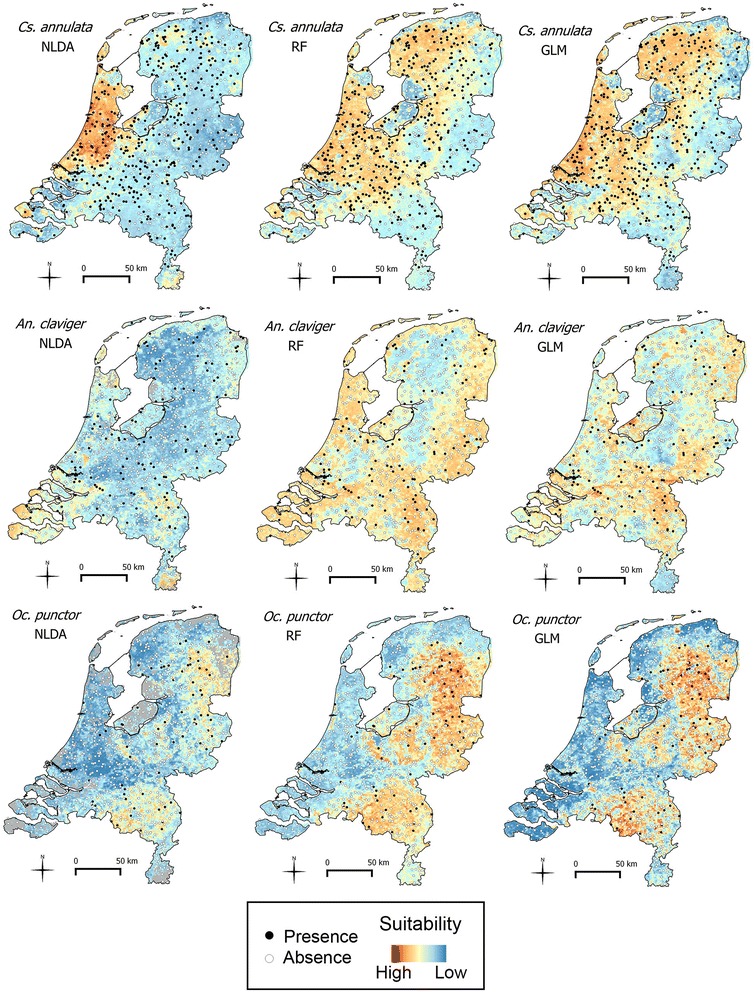
Figure 1.

Environmental suitability maps. Environmental suitability maps for Cs. annulata, An. claviger and Oc. punctor, produced using non-linear discriminant analysis (NLDA), random forest (RF) and generalised linear model (GLM). Black dots indicate that the species was captured on the sampled locations and white dots indicate that the species was not captured. Environmental suitability is depicted using a gradient fill: blue indicates low environmental suitability, red indicates high suitability. NLDA and GLM bootstrapping was based on 150 presence points and 150 absence points for Cs. annulata and 100 presence points and 100 absence points for An. claviger and Oc. punctor.
