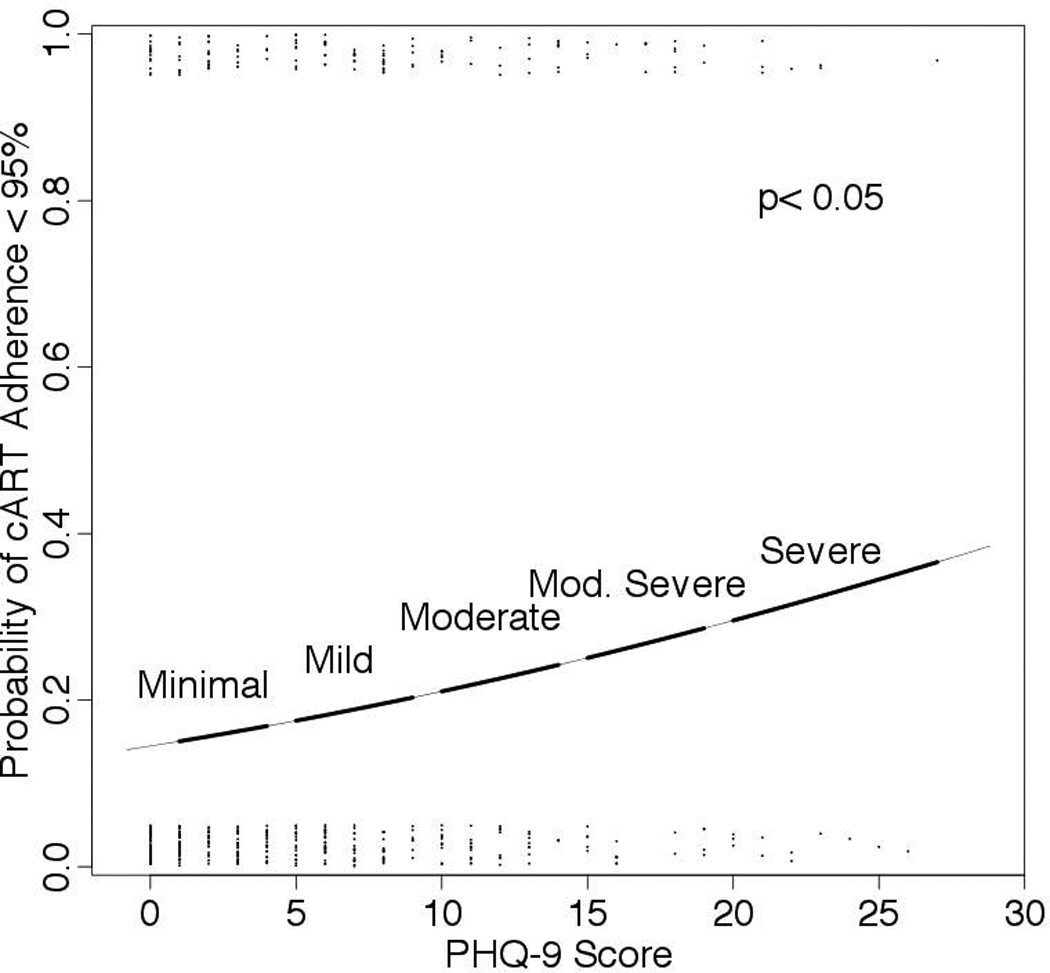
Figure 3.

Probability of cART adherence < 95% in the multivariate model. Fitted logistic regression estimating the probability of cART adherence < 95%. Jittered dots represent PHQ-9 score data. This multivariate model includes age, race, tobacco use and receipt of PI-based vs. NNRTI-based cART.
