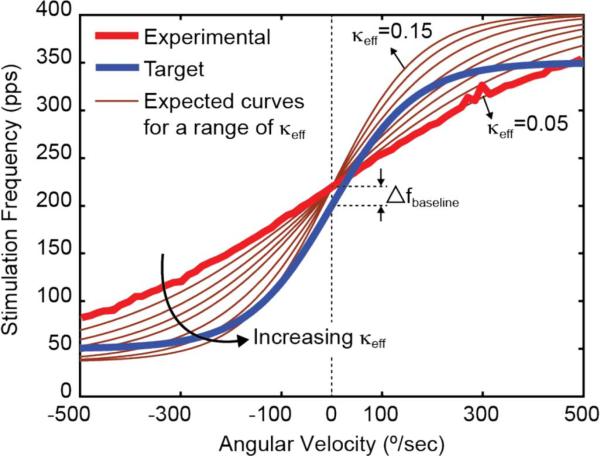
Fig. 6.
Stimulation frequency versus angular velocity. The experimental stimulation frequency (pulse rate) as a function of angular velocity is shown. Superimposed on the plot is a a series of curves illustrating fstim versus angular velocity for κeff (0.05–0.15). The steepness of the curve is controlled by the κeff of the FGOTA. The baseline frequency difference between the experimental and the target curves, Δfbaseline, can be adjusted by decreasing (controlled by Vcontrol). To control the stimulation frequency range, the following values can be adjusted: the bias current of the FGOTA, Ibias, and the current ratio of the mismatched current mirror, I3 / I2(2), and the capacitance C2 (3).

