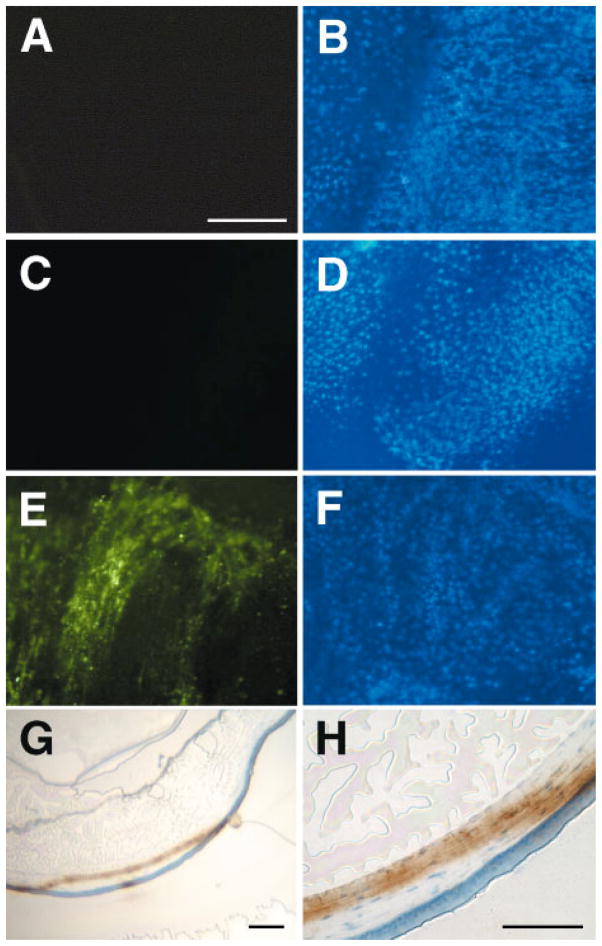
Figure 6.
GFP expression in electroporated eyes. Eyes (n=8) were injected subconjunctivally with saline (A and B) or 5 μg of pEGFP-N1 (C–F) and electroporated at 200 V/cm. Three days later, they were removed and either flattened on microscope slides (A–D) or embedded in OCT and sectioned (10 μm thick, E and F) and observed for GFP expression. GFP expression was detected by direct fluorescence in A–D, or by immunohistochemistry using an antibody against GFP followed by deposition of DAB and counter-staining with hematoxylin (brown color, E and F). Eyes in A–D were stained with DAPI (B and D) to visualize nuclei and the same fields that were photographed for GFP expression (A and C). Panels A–D are all at the same magnification; bar=200 μm. Bar=200 μm in G and 50 μm in H

